The New Housing Reality
A steady job used to mean a path to homeownership. Now? Not so much. Incomes haven’t caught up with the housing surge, and in some cities, the gap between what you make and what homes cost is just too big.

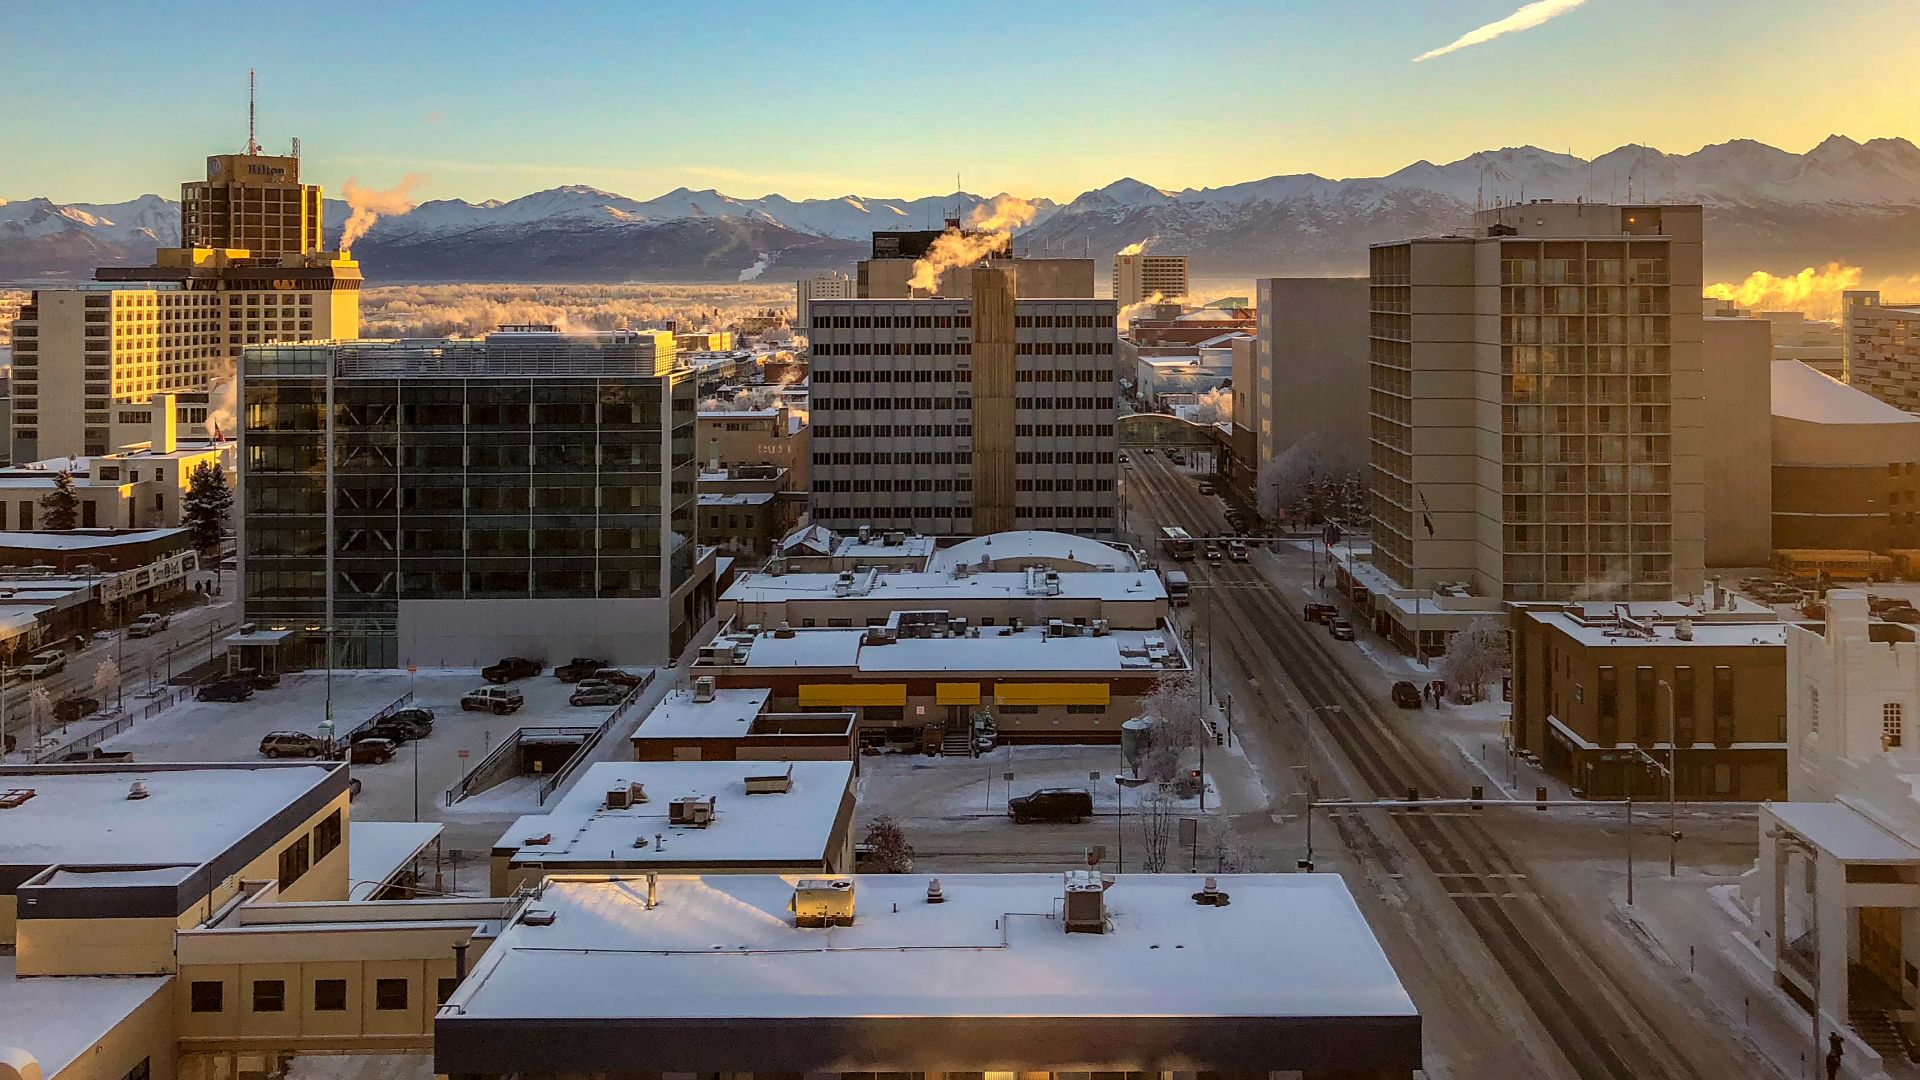
Anchorage, Alaska
Rugged beauty doesn’t shield Anchorage from a growing affordability crunch. The city’s median home price of about $394,266 towers over its median income of $98,152, creating a 4.0x ratio. Residents find themselves squeezed as wages struggle to keep pace with Alaska’s soaring property market.
 Will Buckner, Wikimedia Commons
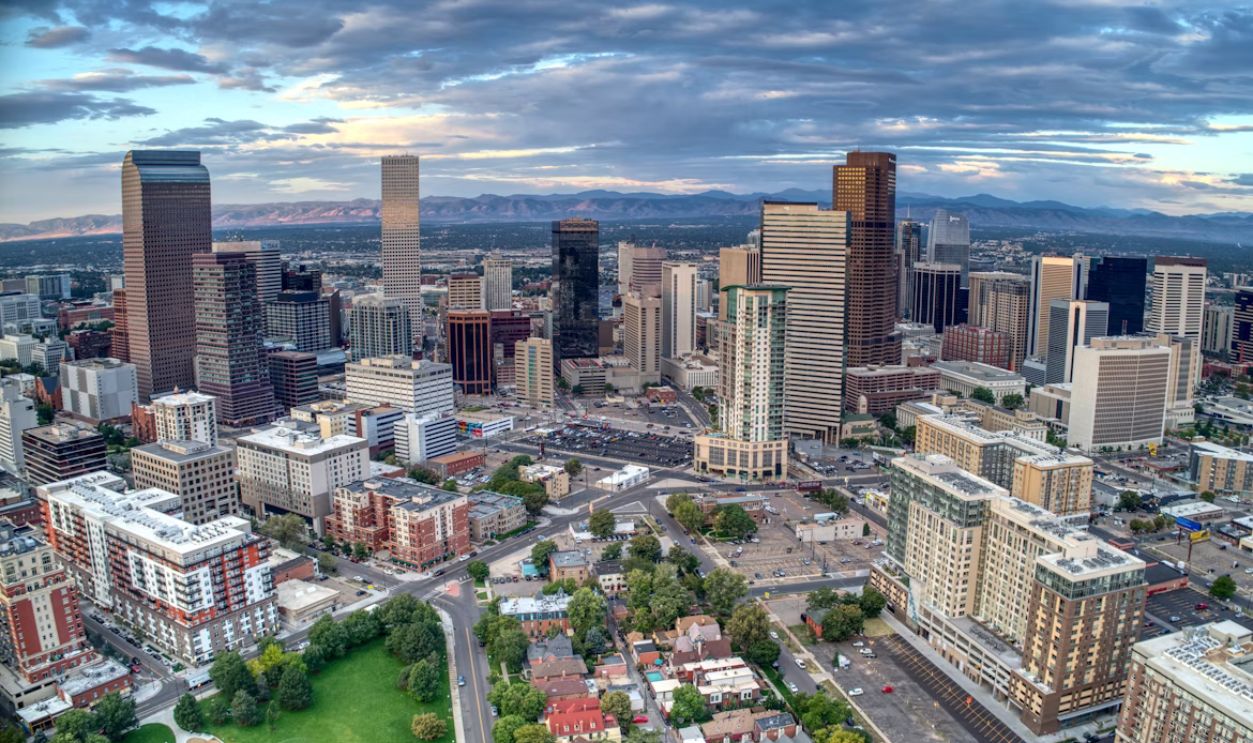
Denver, Colorado
At $558,705 per home and a median income of $85,853, Denver’s 6.5x ratio shows how steep the climb has become. Even with solid jobs and fresh energy, housing access keeps slipping away in this once dream-worthy city.
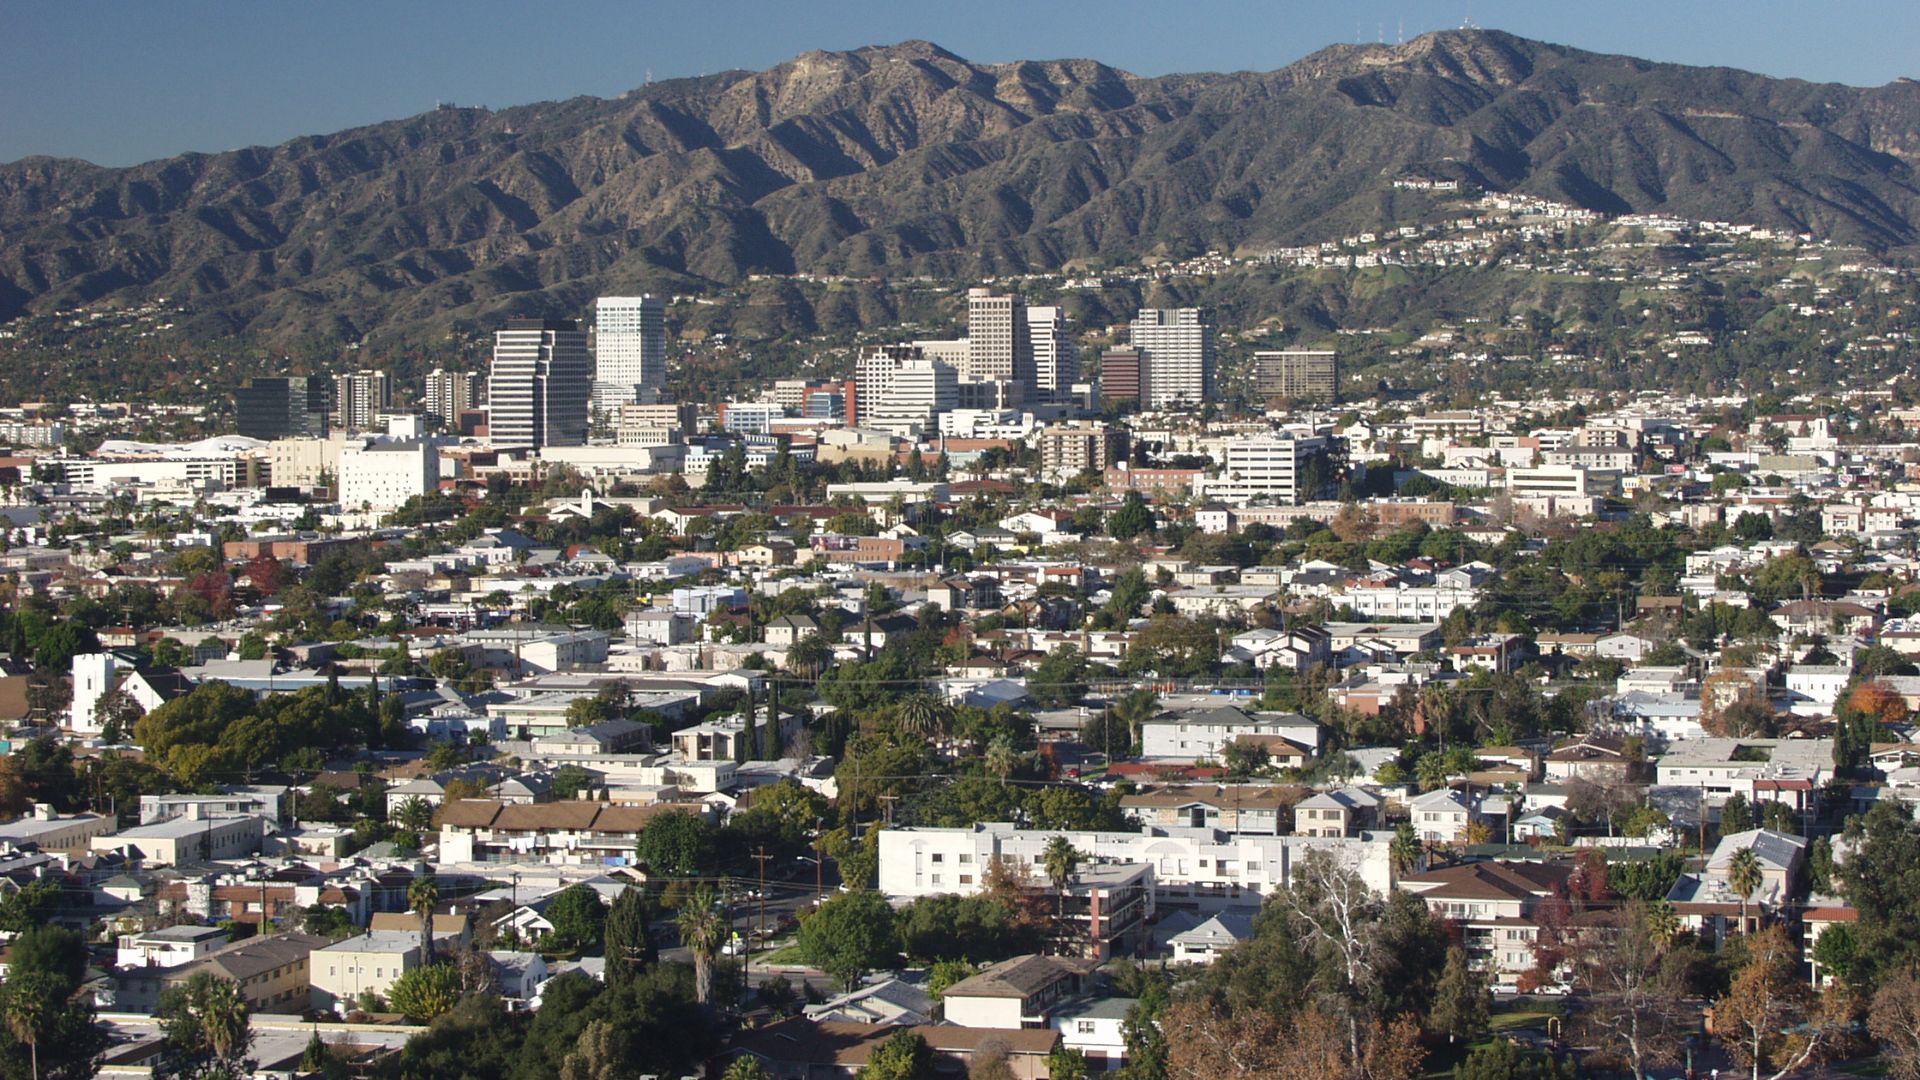
Glendale, California
Luxury living comes at a price in Glendale. The median home value has skyrocketed to $1.1 million, while the average household earns just $87,326. With a 12.8x ratio, many locals find it difficult to buy in this Los Angeles suburb known for its lively Armenian community.
Bridgeport, Connecticut
Homeownership feels distant for many in Bridgeport because the city’s expenses continue to climb faster than wages, echoing a trend seen throughout much of coastal Connecticut. With median home prices around $302,674 and incomes averaging $54,440, the 5.6x ratio exposes a widening gap.
 Quintin Soloviev, Wikimedia Commons
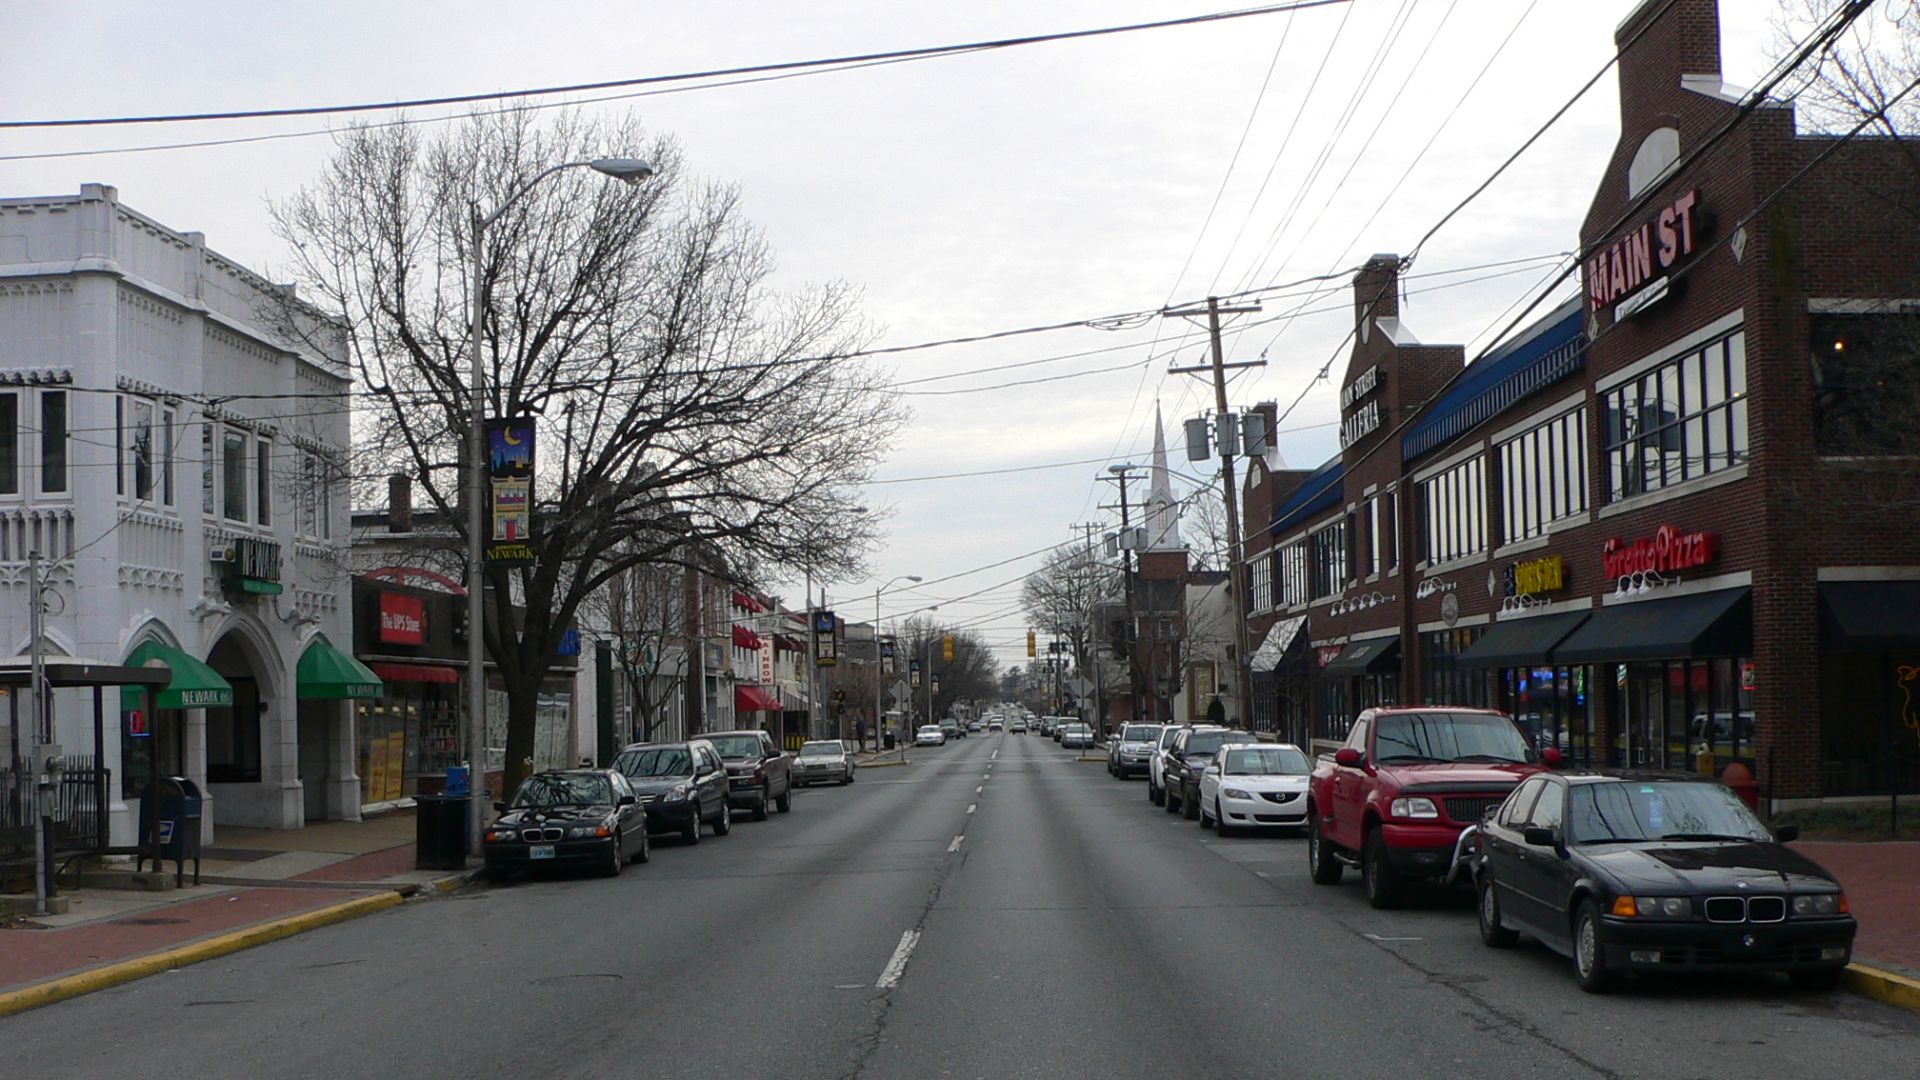
Newark, Delaware
Housing access has slipped quietly in Newark. Homes now average $340,971, and the median household income rests near $71,373, which creates a 4.8x price-to-income ratio. The market’s steady rise has left many residents facing mounting financial pressure as local salaries lag behind housing growth.
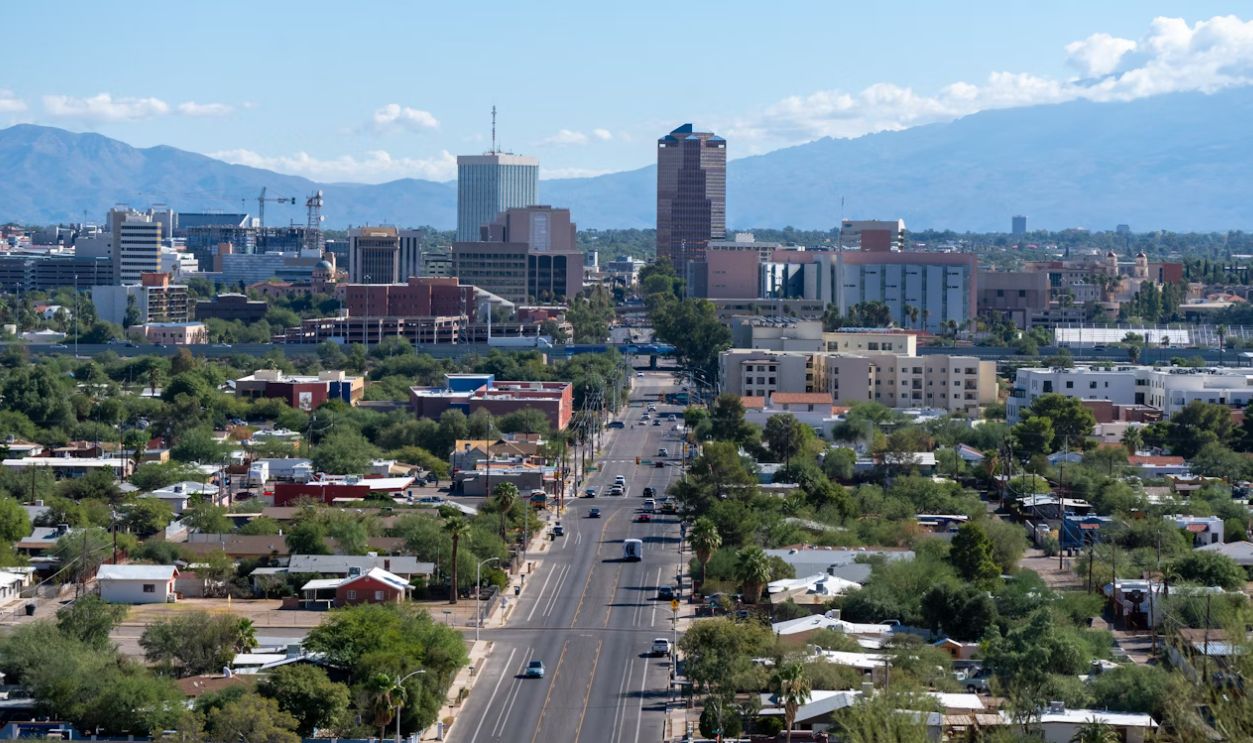
Tucson, Arizona
A $332,818 median home against a $67,929 income sets Tucson’s ratio near 4.9x. The math stings for locals who once saw the city as a bargain. Even with the sunsets and laid-back charm, rising mortgage rates have turned Tucson’s easy living into a financial strain.
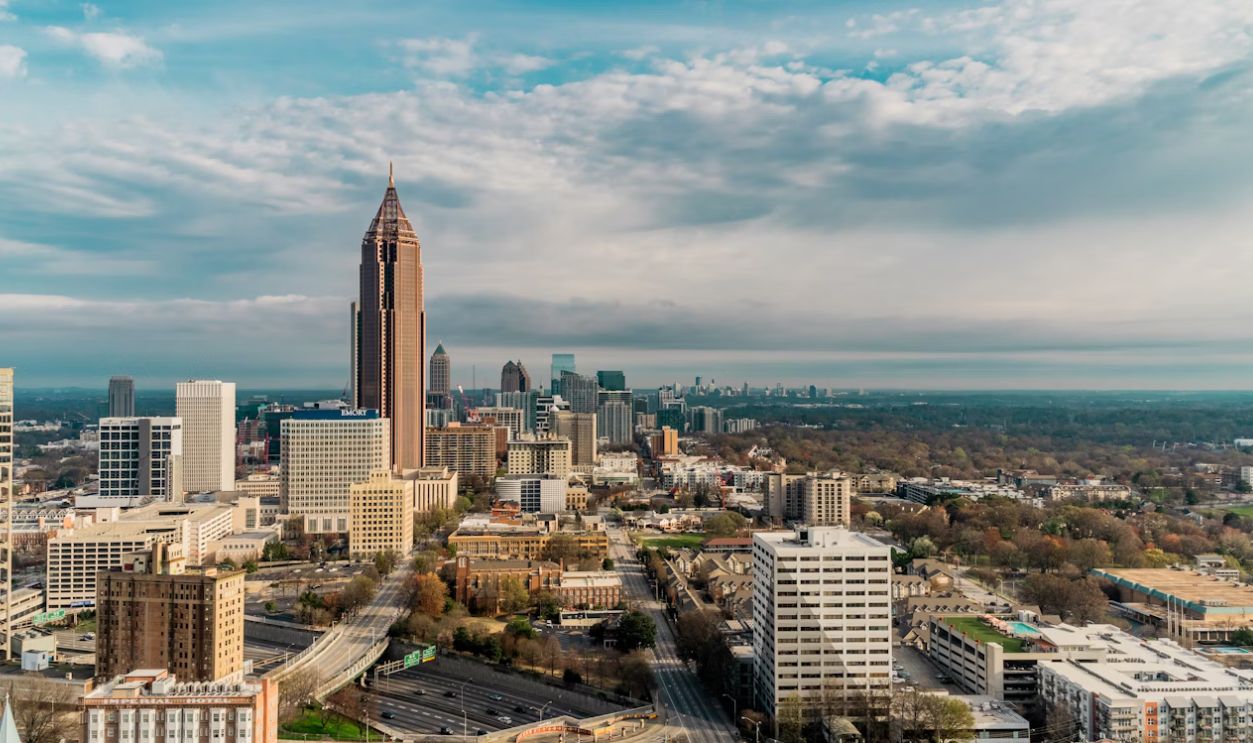
Atlanta, Georgia
Georgia’s capital shines with opportunity, but housing access is dimming. The typical home price of $379,911 far outpaces the city’s median income of $77,655, and the 4.9x ratio leaves many Atlantans balancing ambition with the escalating expenses of living.
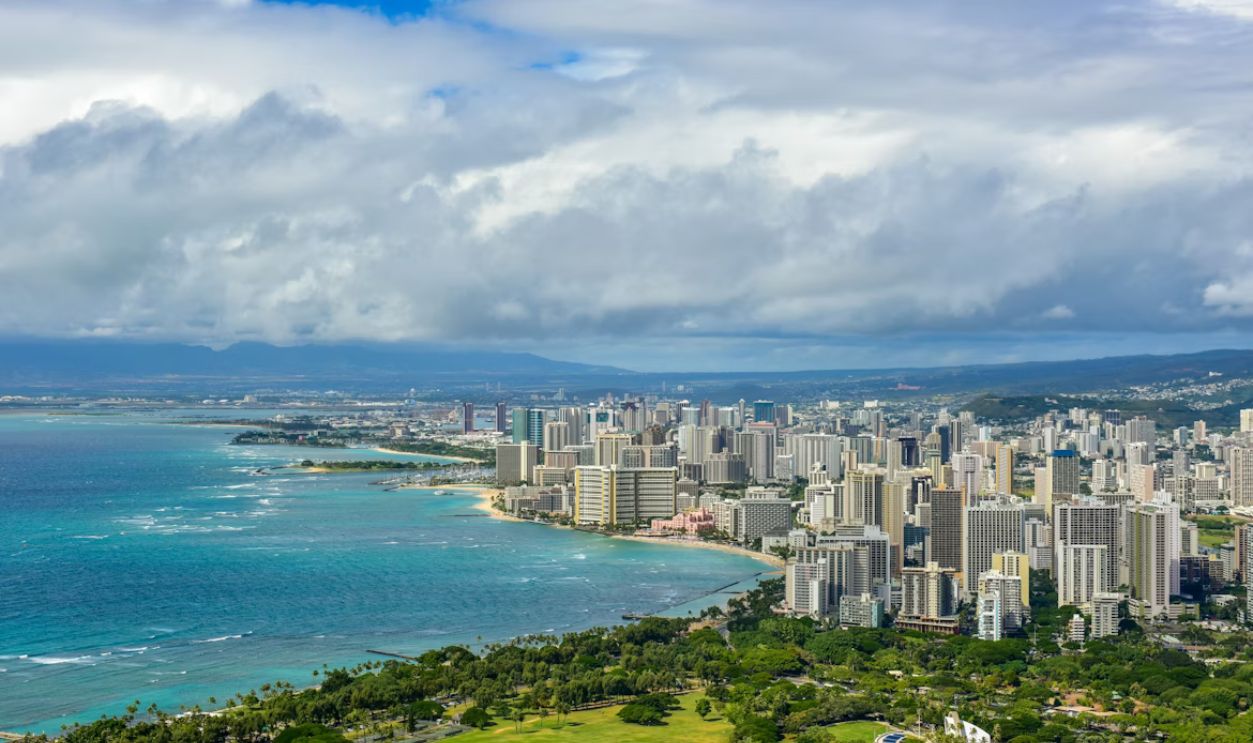
Urban Honolulu, Hawaii
Paradise carries a heavy price tag, with homes averaging $800,614 and a median income of $91,312. The resulting 8.8x ratio ranks among the highest nationwide and leaves even well-paid locals struggling to secure property in one of America’s most scenic locations.
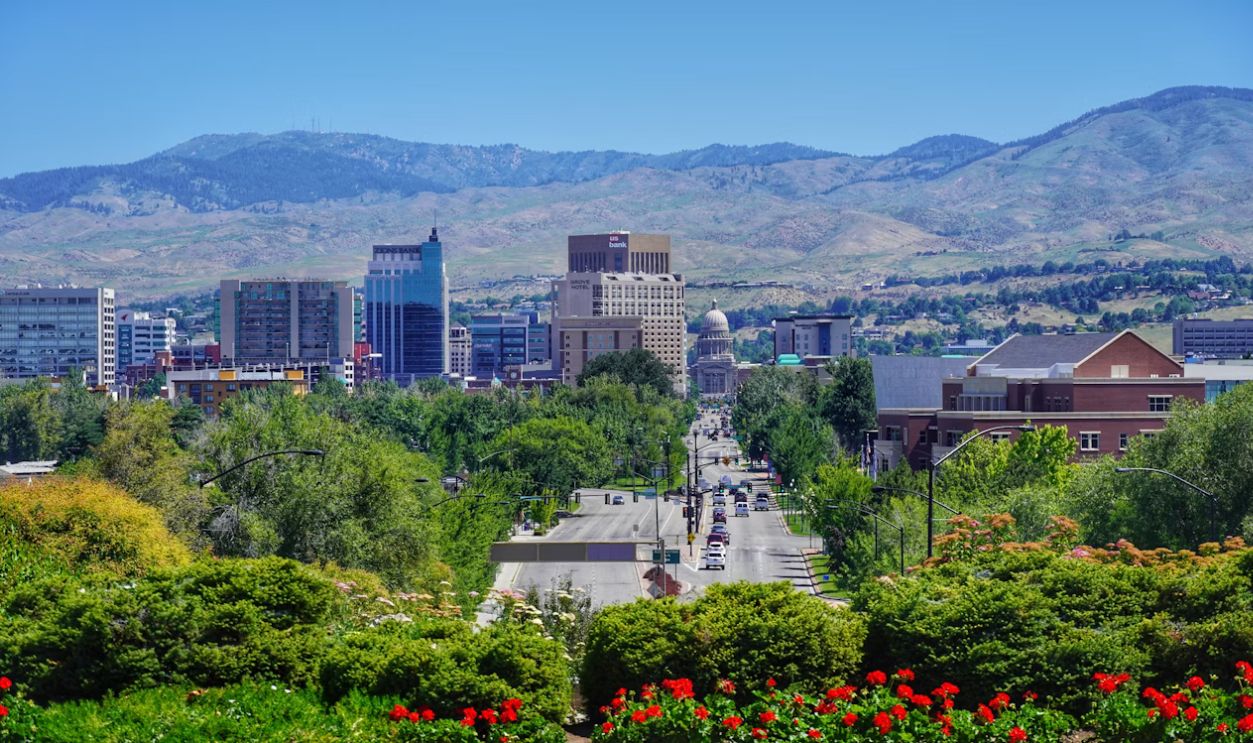
Boise, Idaho
Not long ago, Boise symbolized affordability—now it’s edging out first-time buyers. Why? First, the median home price now stands at $502,667, compared to a median income of $84,769. Secondly, with a 5.9x ratio, new buyers face an uphill climb as the market continues to outpace earnings.
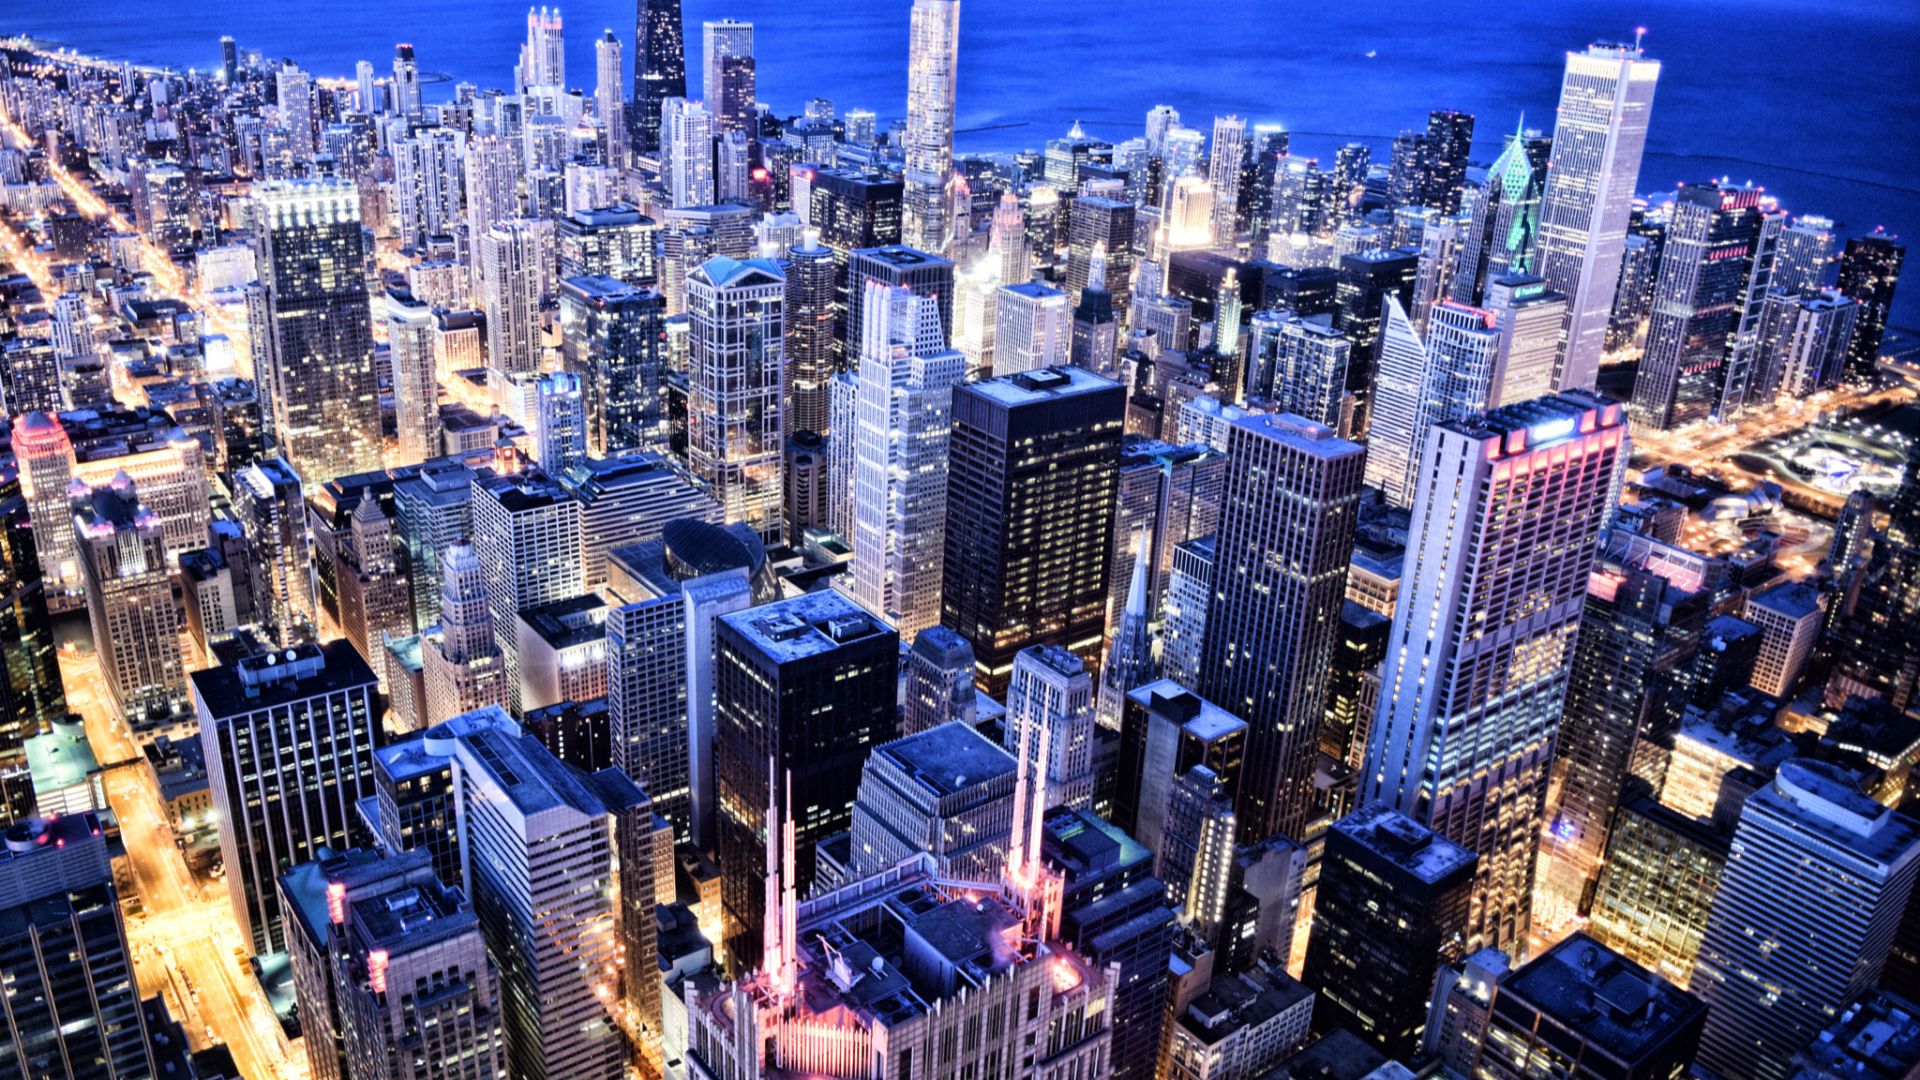
Chicago, Illinois
Though Chicago remains cheaper than many major metros, housing access is slipping (fast). Property taxes are on an up-trend faster than wages, and this further tightens budgets for homeowners. Its median home price of $315,024 versus a $75,134 income results in a 4.2x ratio.
 Jesse Collins, Wikimedia Commons
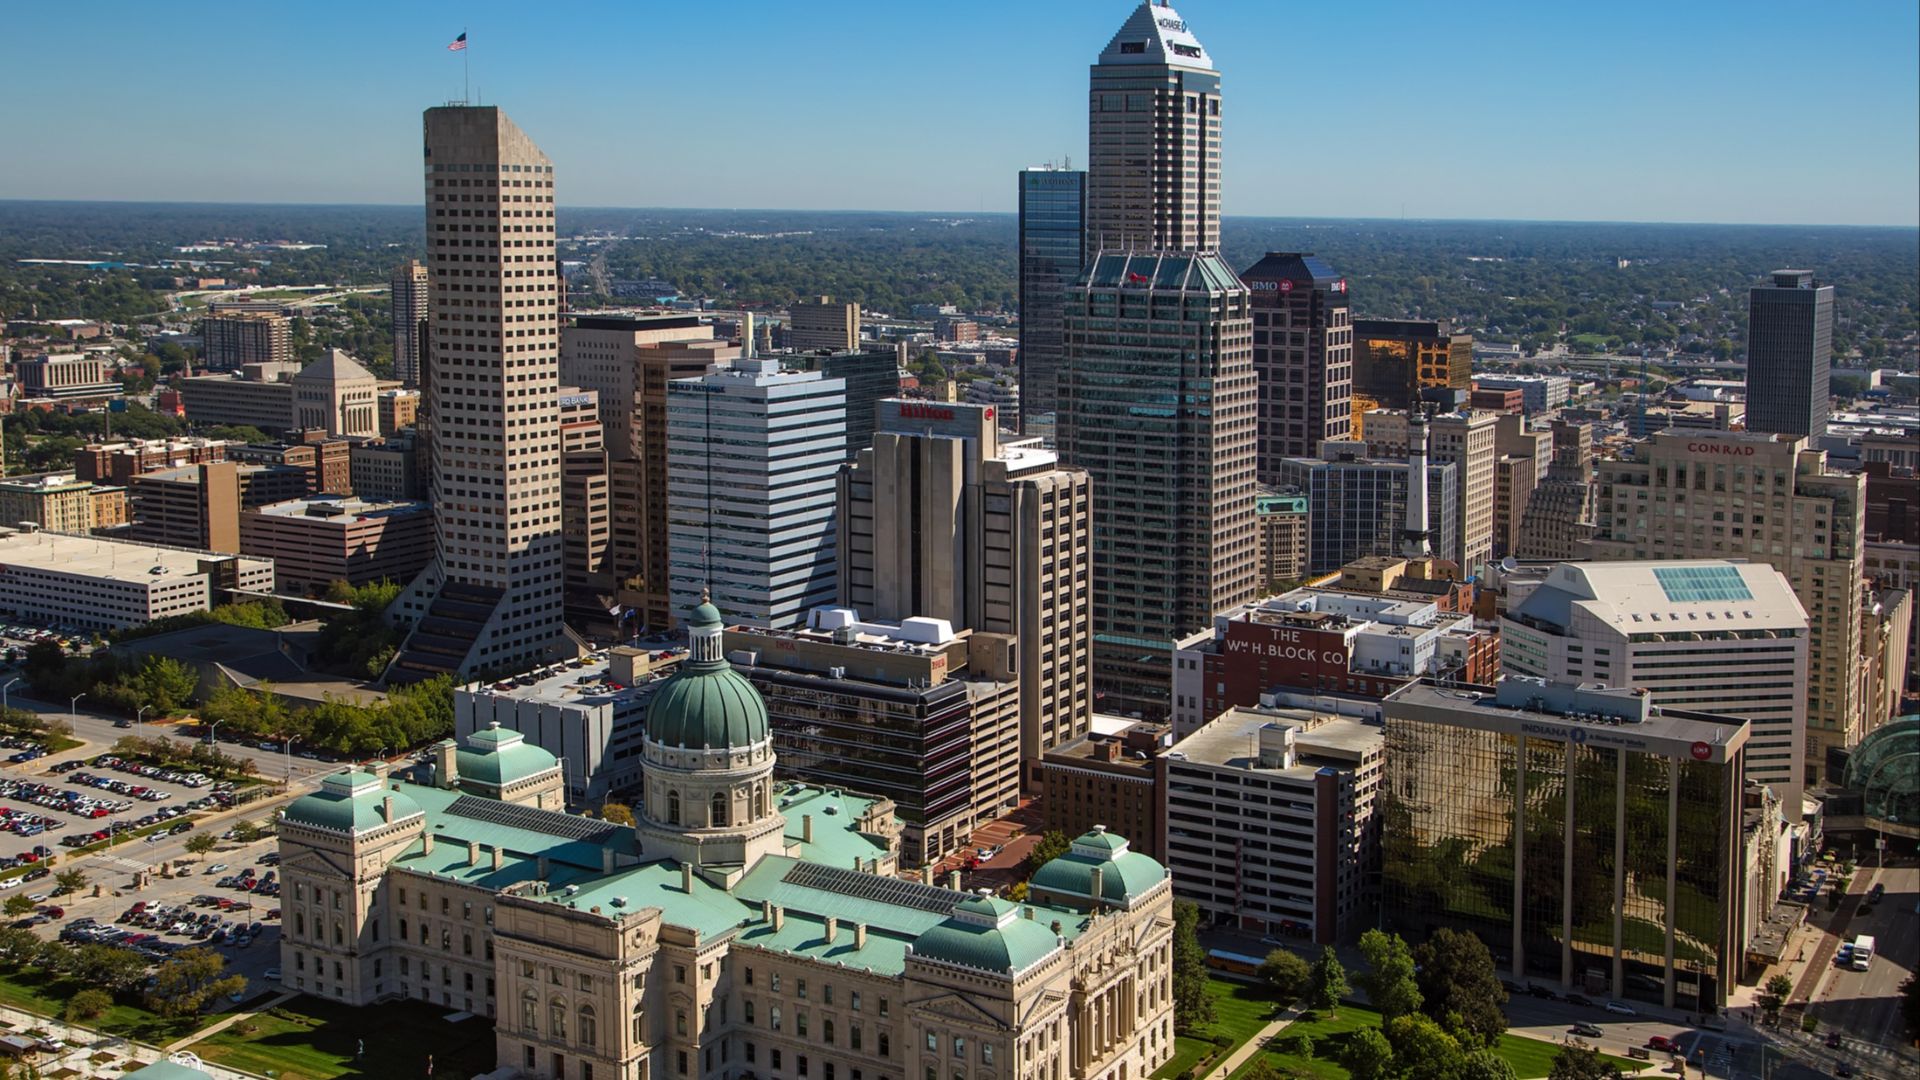
Indianapolis, Indiana
In the heart of the Midwest, the housing gaps widen day after day. Indianapolis homes average $223,697, and household income sits at $62,995. The 3.6x ratio reflects a market climbing beyond reach for some residents, which is challenging the city’s long-held reputation for accessible living.
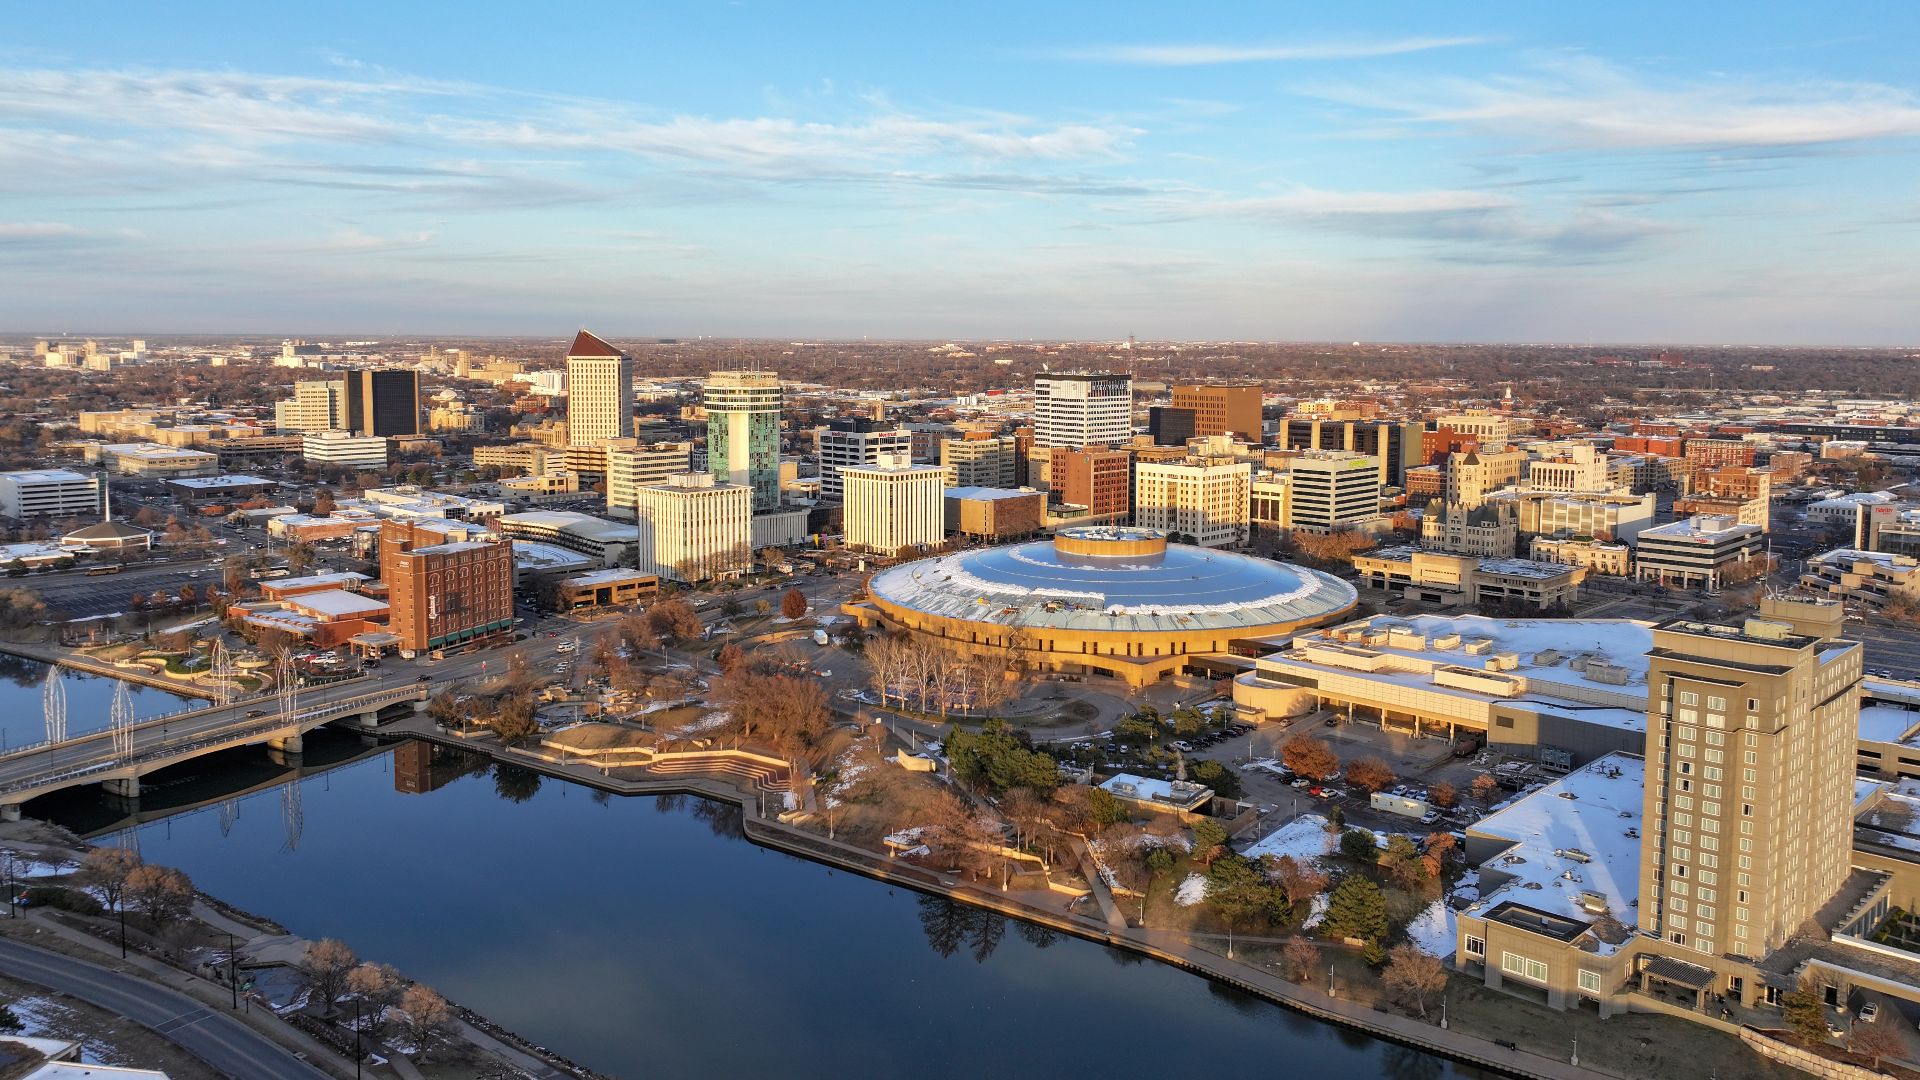
Wichita, Kansas
While Wichita remains one of the more “budget-friendly” cities on this list, expenses are still rising faster than paychecks. With a median home price of $201,526 and an income of $60,712, its 3.3x ratio hints at mounting pressure in Kansas’s largest city.
 Quintin Soloviev, Wikimedia Commons
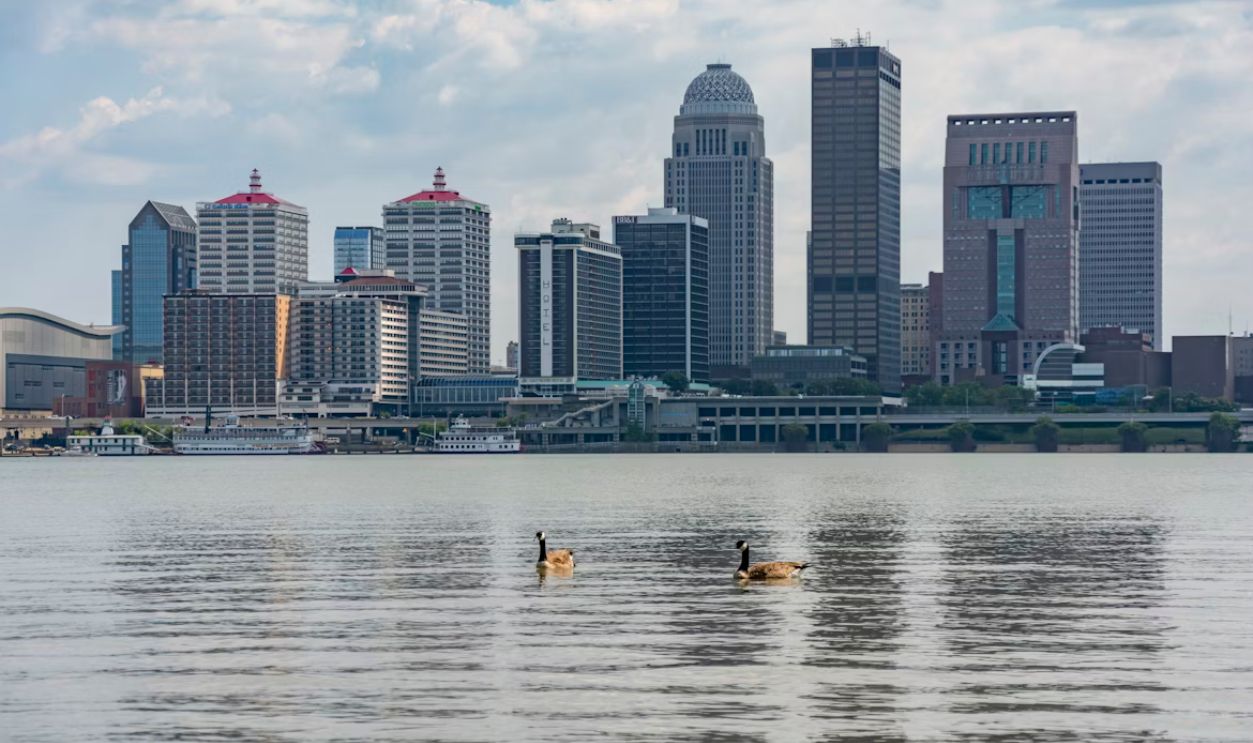
Louisville, Kentucky
Beyond horse racing, Louisville’s new contest pits home prices against household paychecks. The average home sells for $233,462, but the median income sits near $63,114. The resulting 3.7x gap highlights how housing access is tightening here.
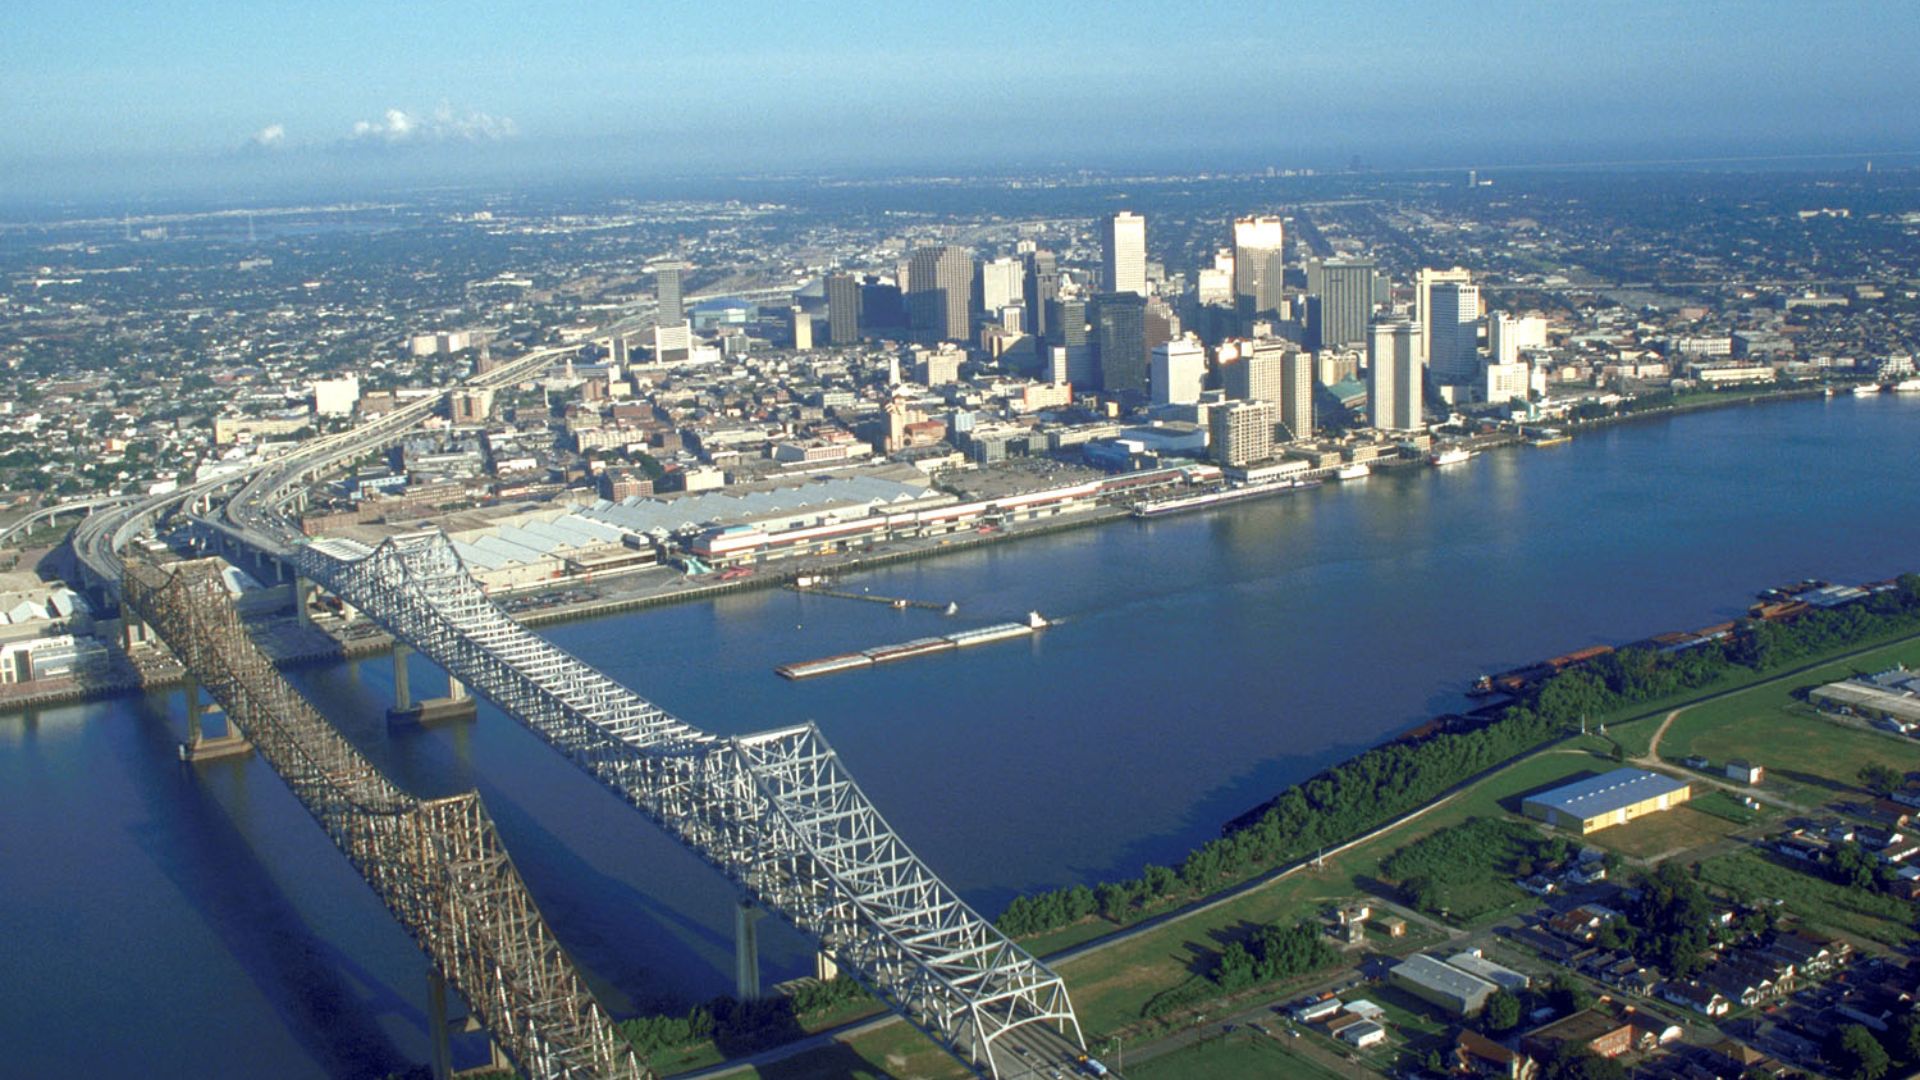
New Orleans, Louisiana
At a median price of $263,349, getting a home here can feel out of reach. Local income sits around $51,116, and this creates a 5.2x stretch between cost and earning power. The result? A market that rewards investors far more than lifelong residents.
 Michael Maples, U.S. Army Corps of Engineers, Wikimedia Commons
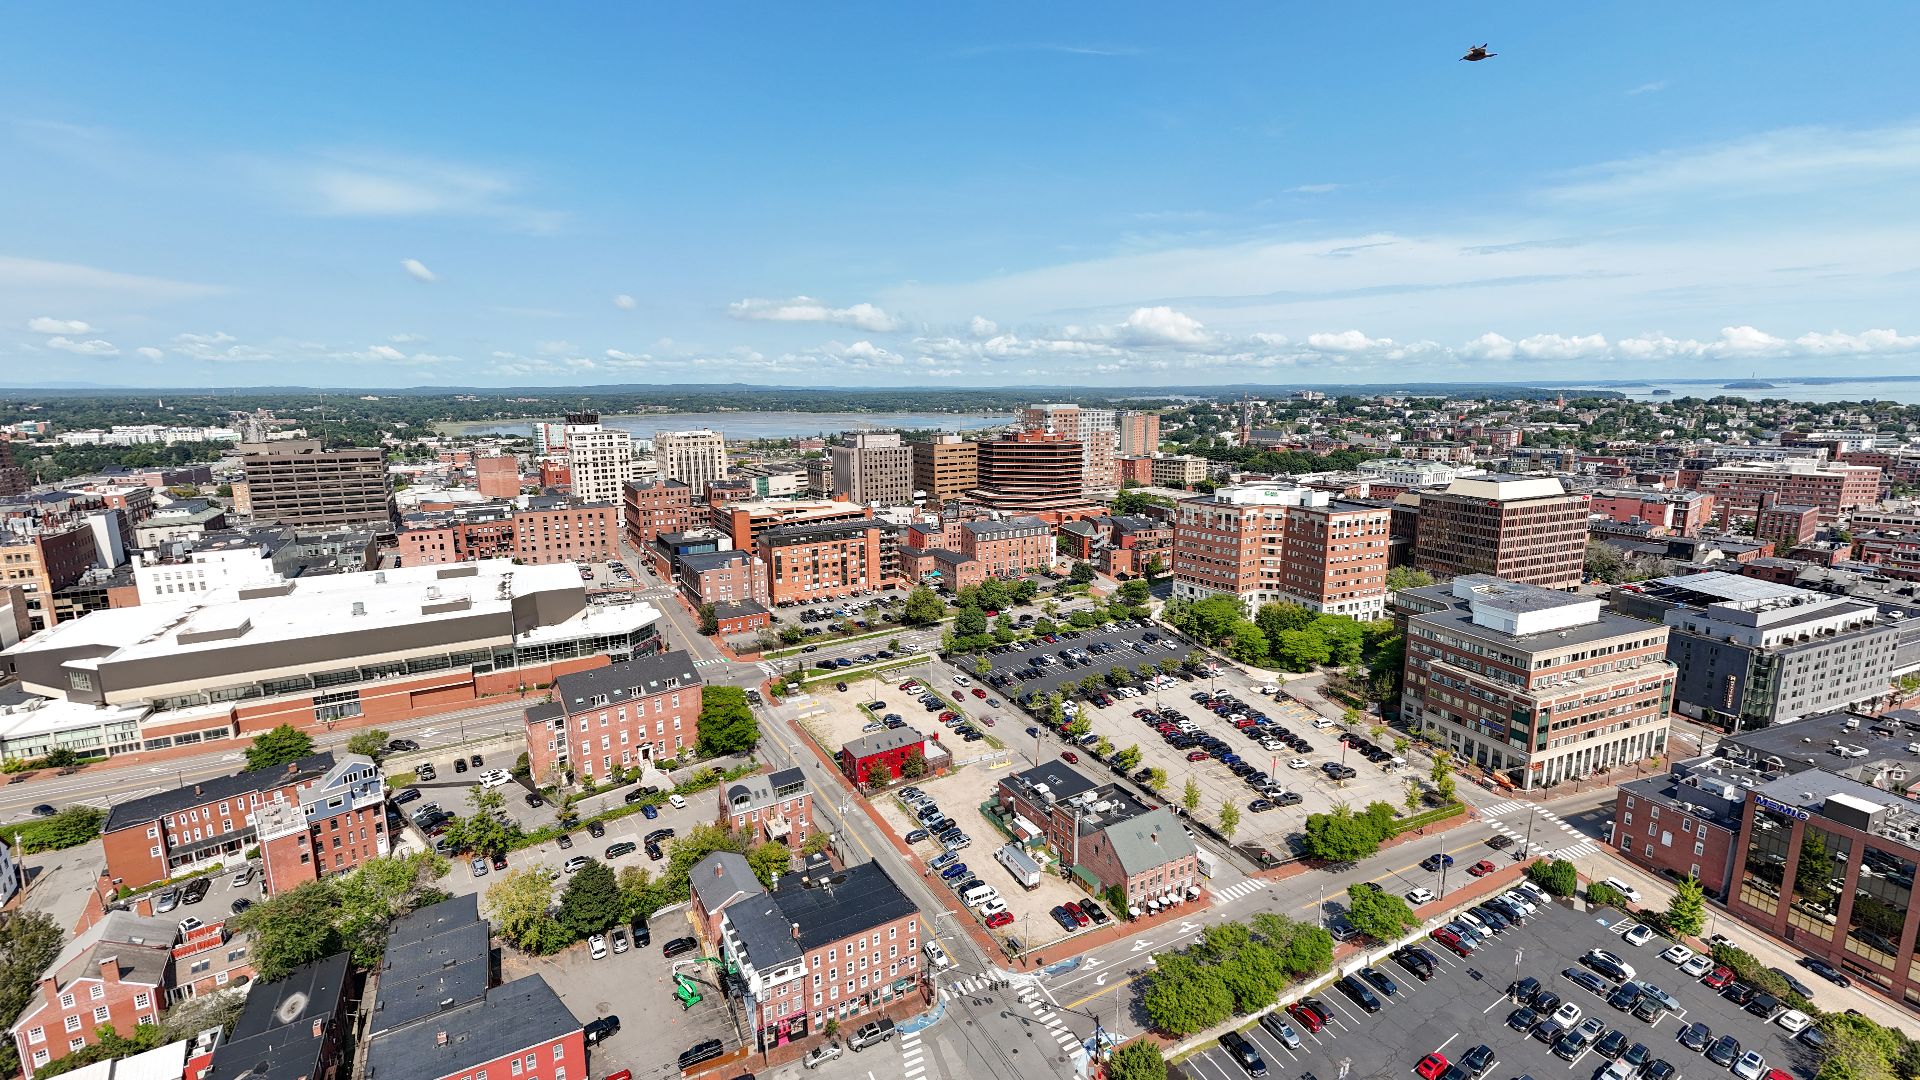
Portland, Maine
The charm of Portland’s harbor views now comes at a steep price. First off, the demand for waterfront living has surged, and this has made Maine’s largest city increasingly expensive for many buyers. Homes average $576,229, and the typical household earns $81,546, resulting in a 7.1x ratio.
 Quintin Soloviev, Wikimedia Commons
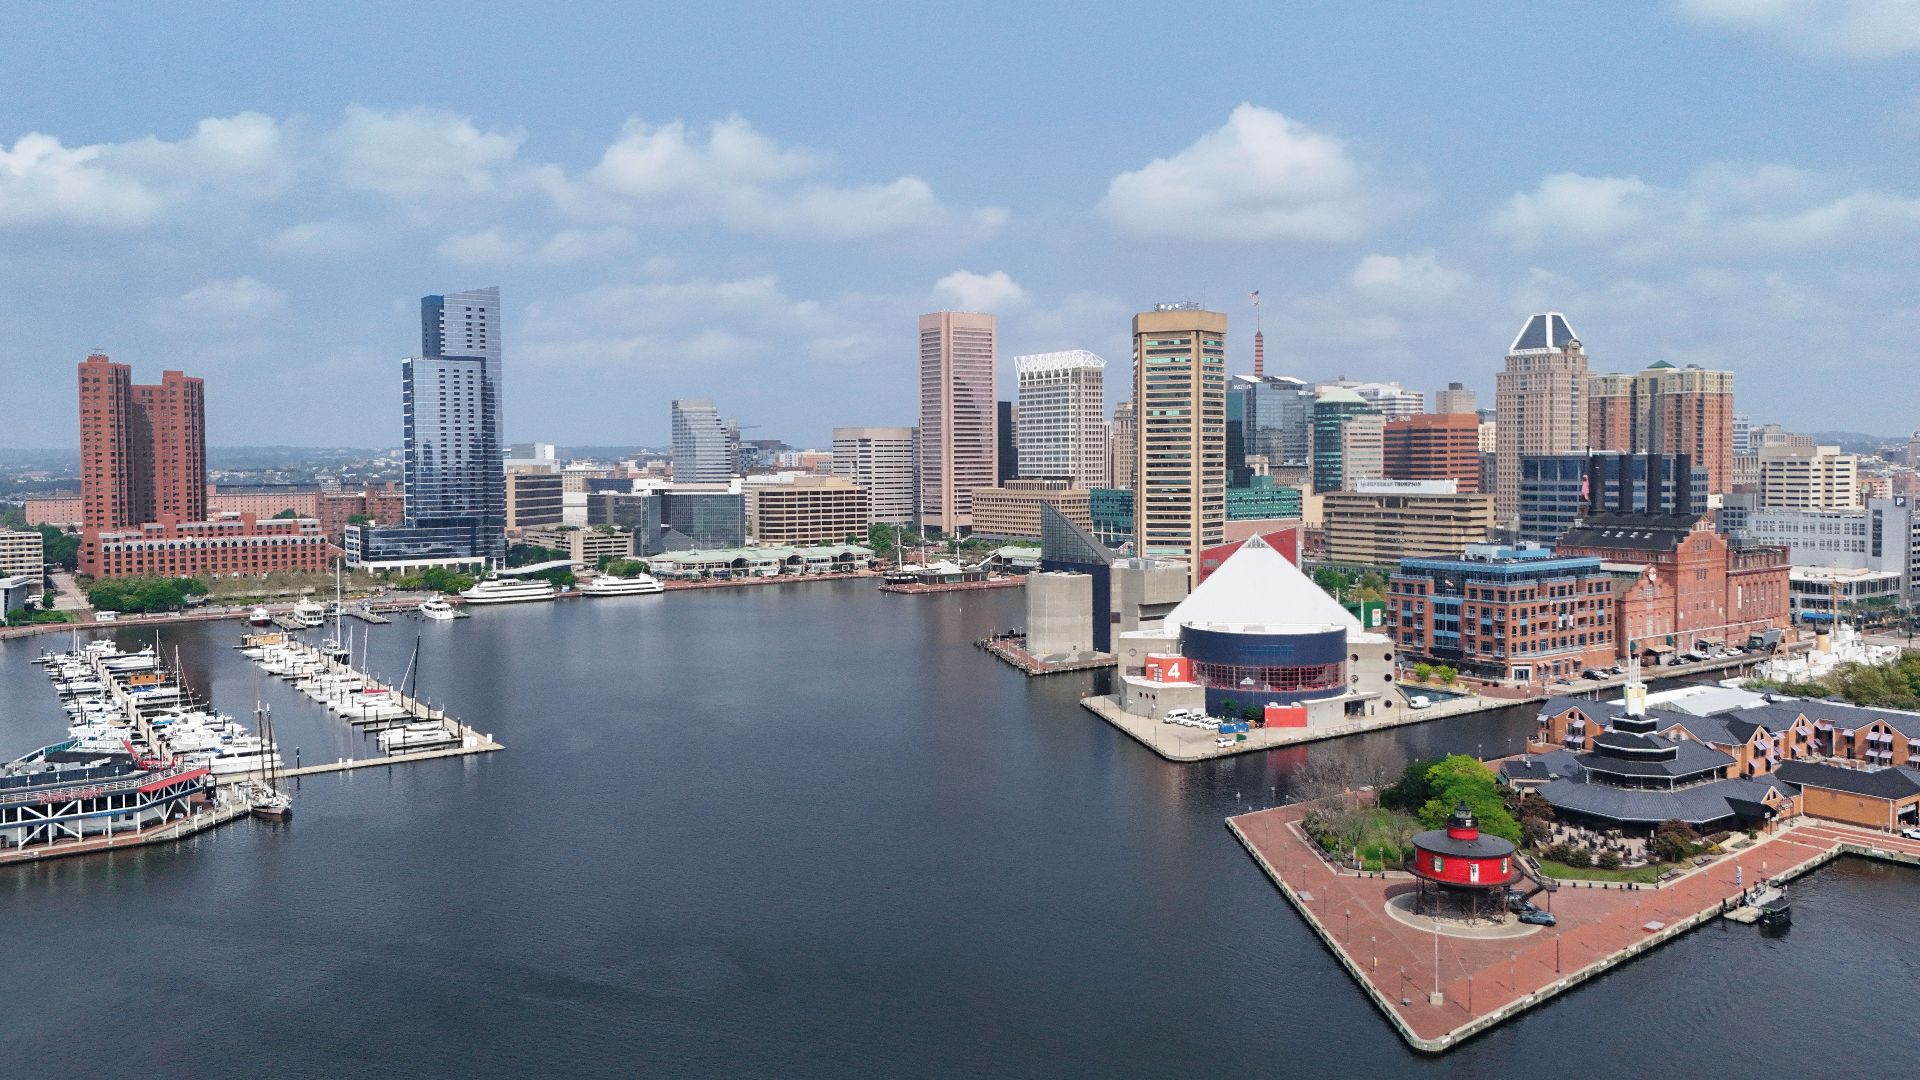
Baltimore, Maryland
In Baltimore, access to homeownership is slowly becoming a “once upon a time” story. The median home rate of $179,536 may appear modest, yet incomes averaging $58,350 reveal a 3.1x ratio. Even though home expenses rise more slowly than elsewhere, many locals still feel the squeeze.
 Quintin Soloviev, Wikimedia Commons
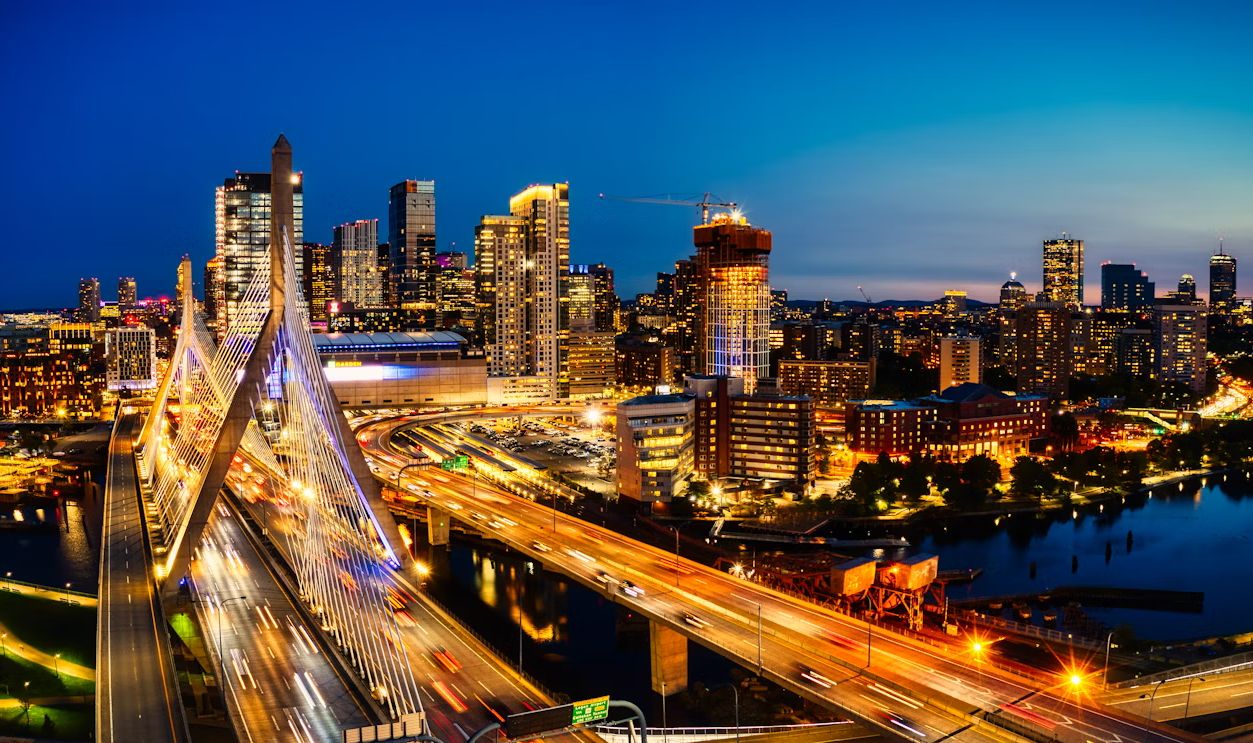
Boston, Massachusetts
Steeped in history and academia, Boston remains one of the country’s most expensive markets. Limited inventory and high demand continue to push property prices beyond the reach of most residents. Properties average $779,777 against a median income of $96,931 to form an 8.0x ratio.
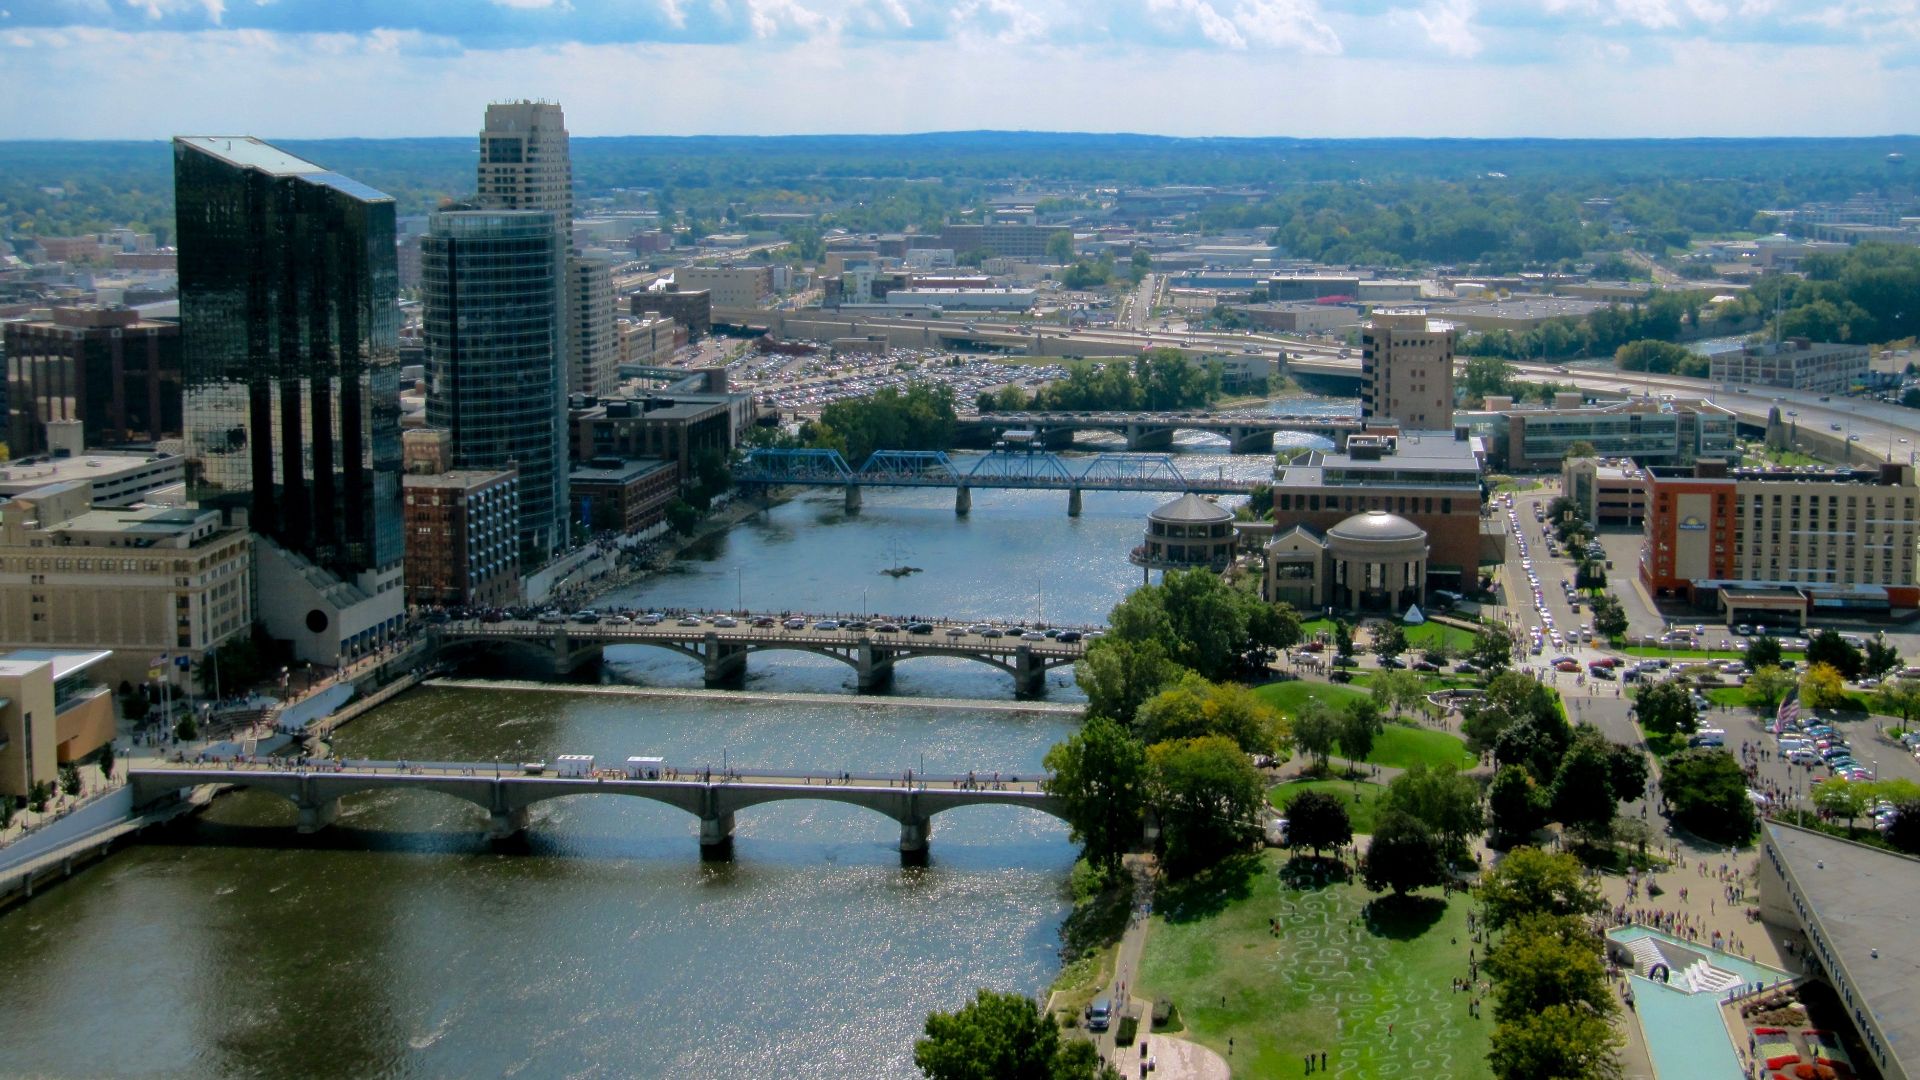
Grand Rapids, Michigan
The price climb in Grand Rapids has surprised many. With a median price of $268,540 and a household income of nearly $65,350, its 4.1x ratio reflects budget-friendliness slipping away. Once considered accessible, this Michigan city is now contending with super-high prices.
 Rachel Kramer, Wikimedia Commons
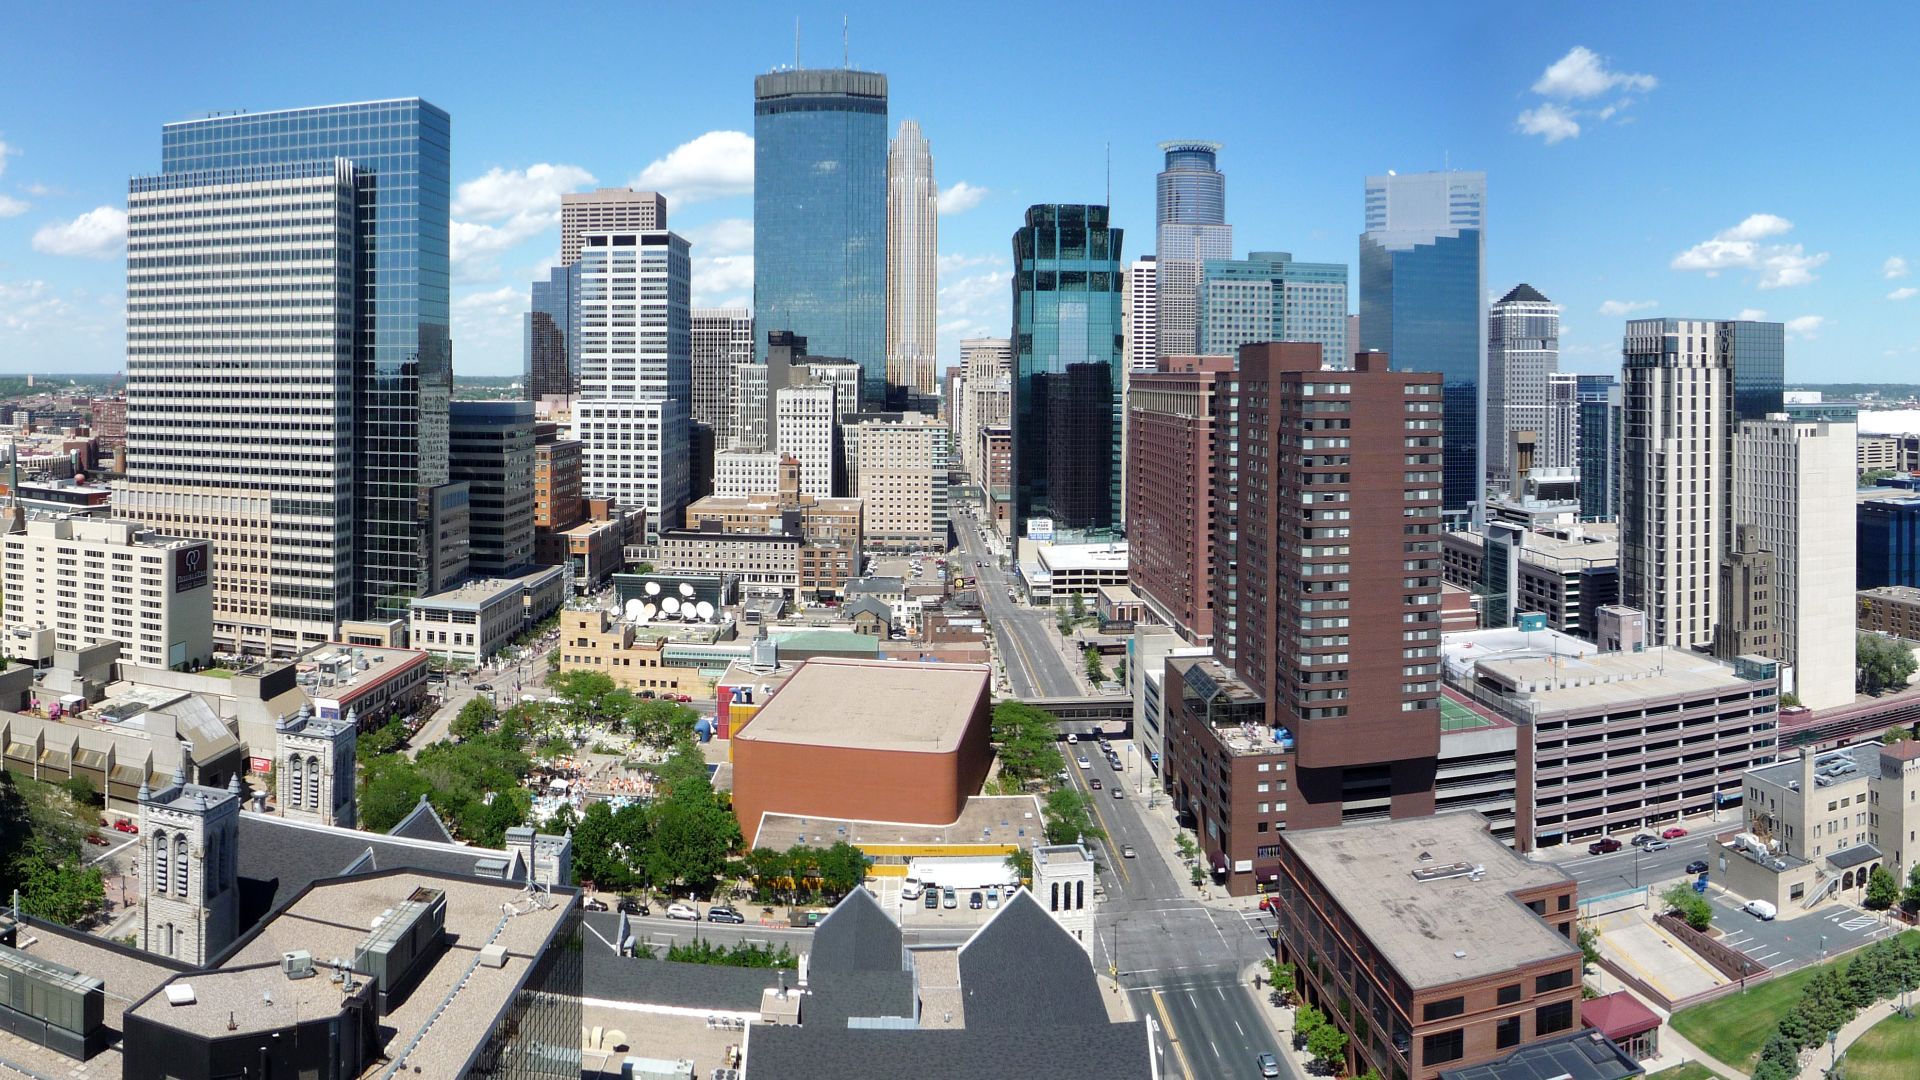
Minneapolis, Minnesota
Here, the living expenses have crept steadily upward. Despite a strong local economy, the balance between earnings and property prices remains increasingly uneven for many urban homeowners. A 3.7x ratio comes from homes averaging $303,761 and incomes reaching $81,001.
 Bobak Ha'Eri, Wikimedia Commons
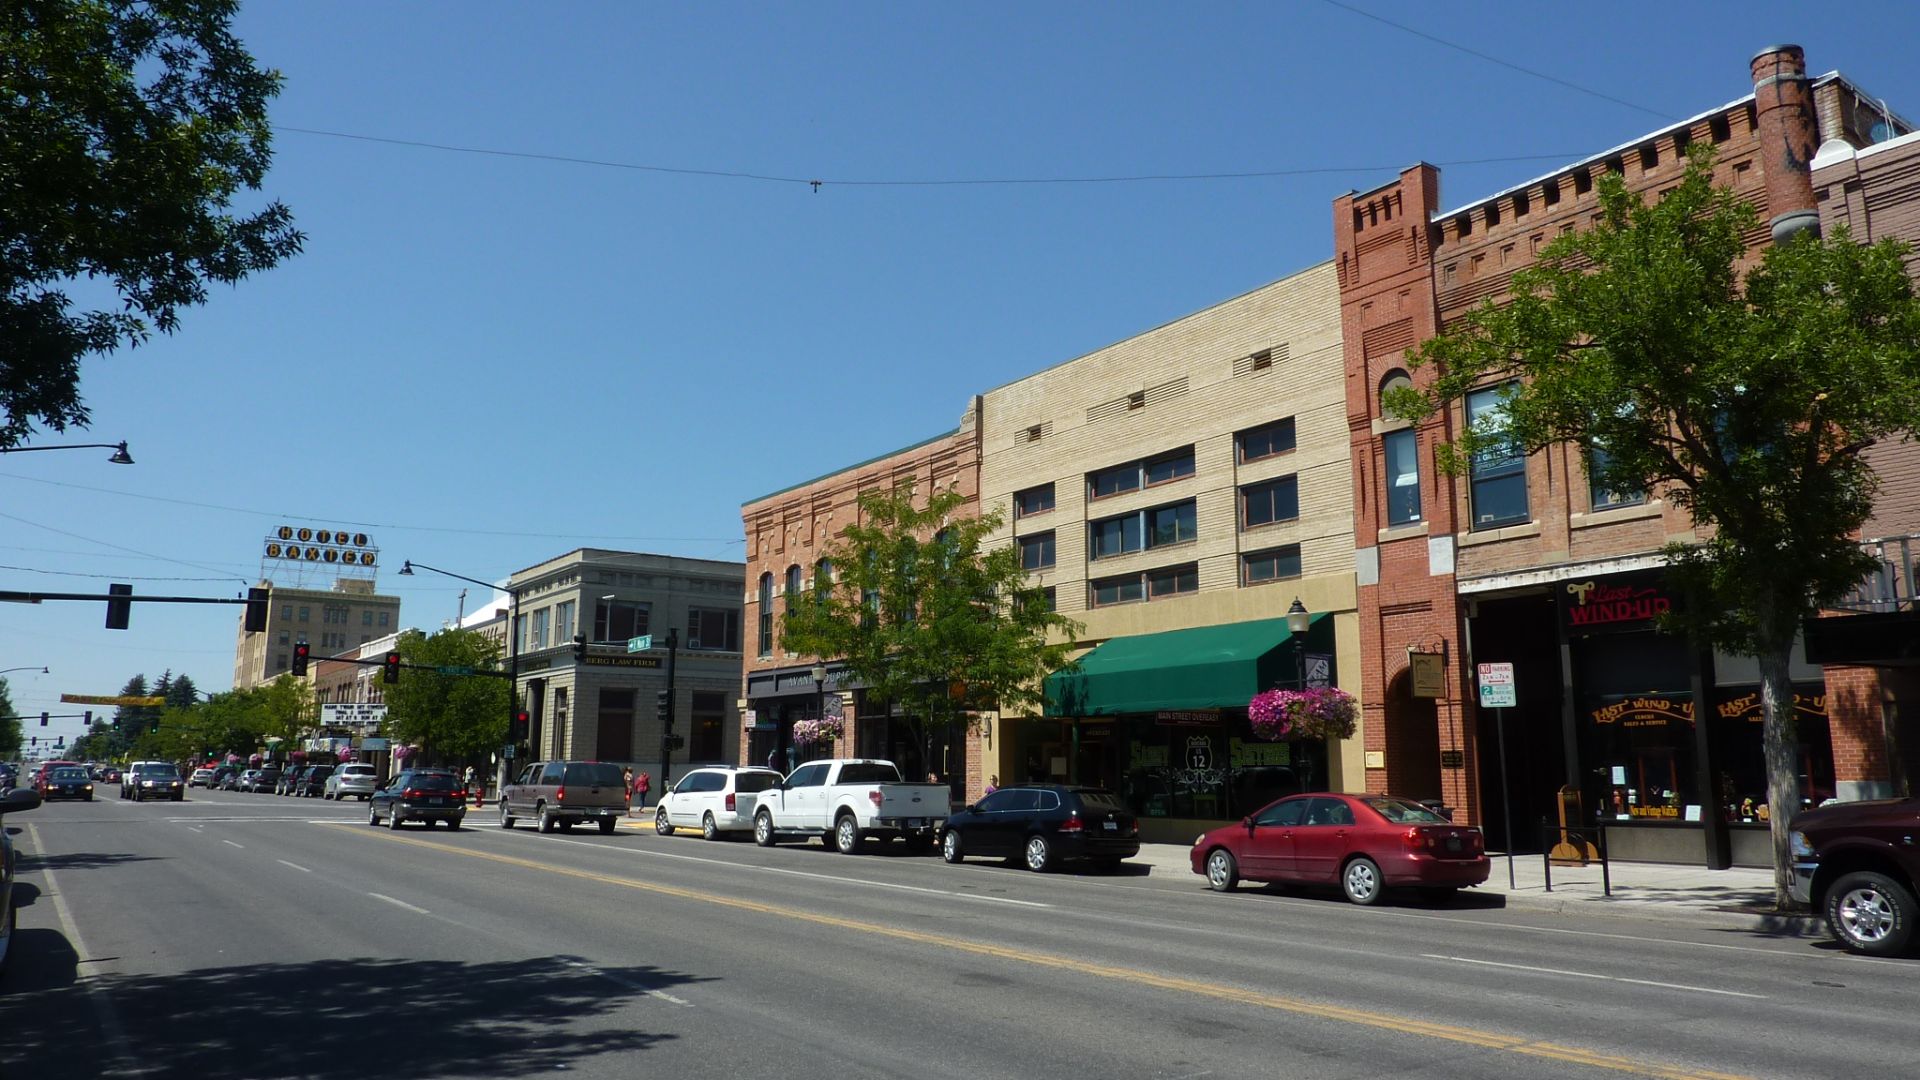
Bozeman, Montana
This city’s median home prices hover around $394,000. Incomes average far less, and this gives Montana a striking 6.4 price-to-income ratio. Surrounded by mountains and Yellowstone’s gateway charm, access to ownership remains a growing challenge even amid the beauty.
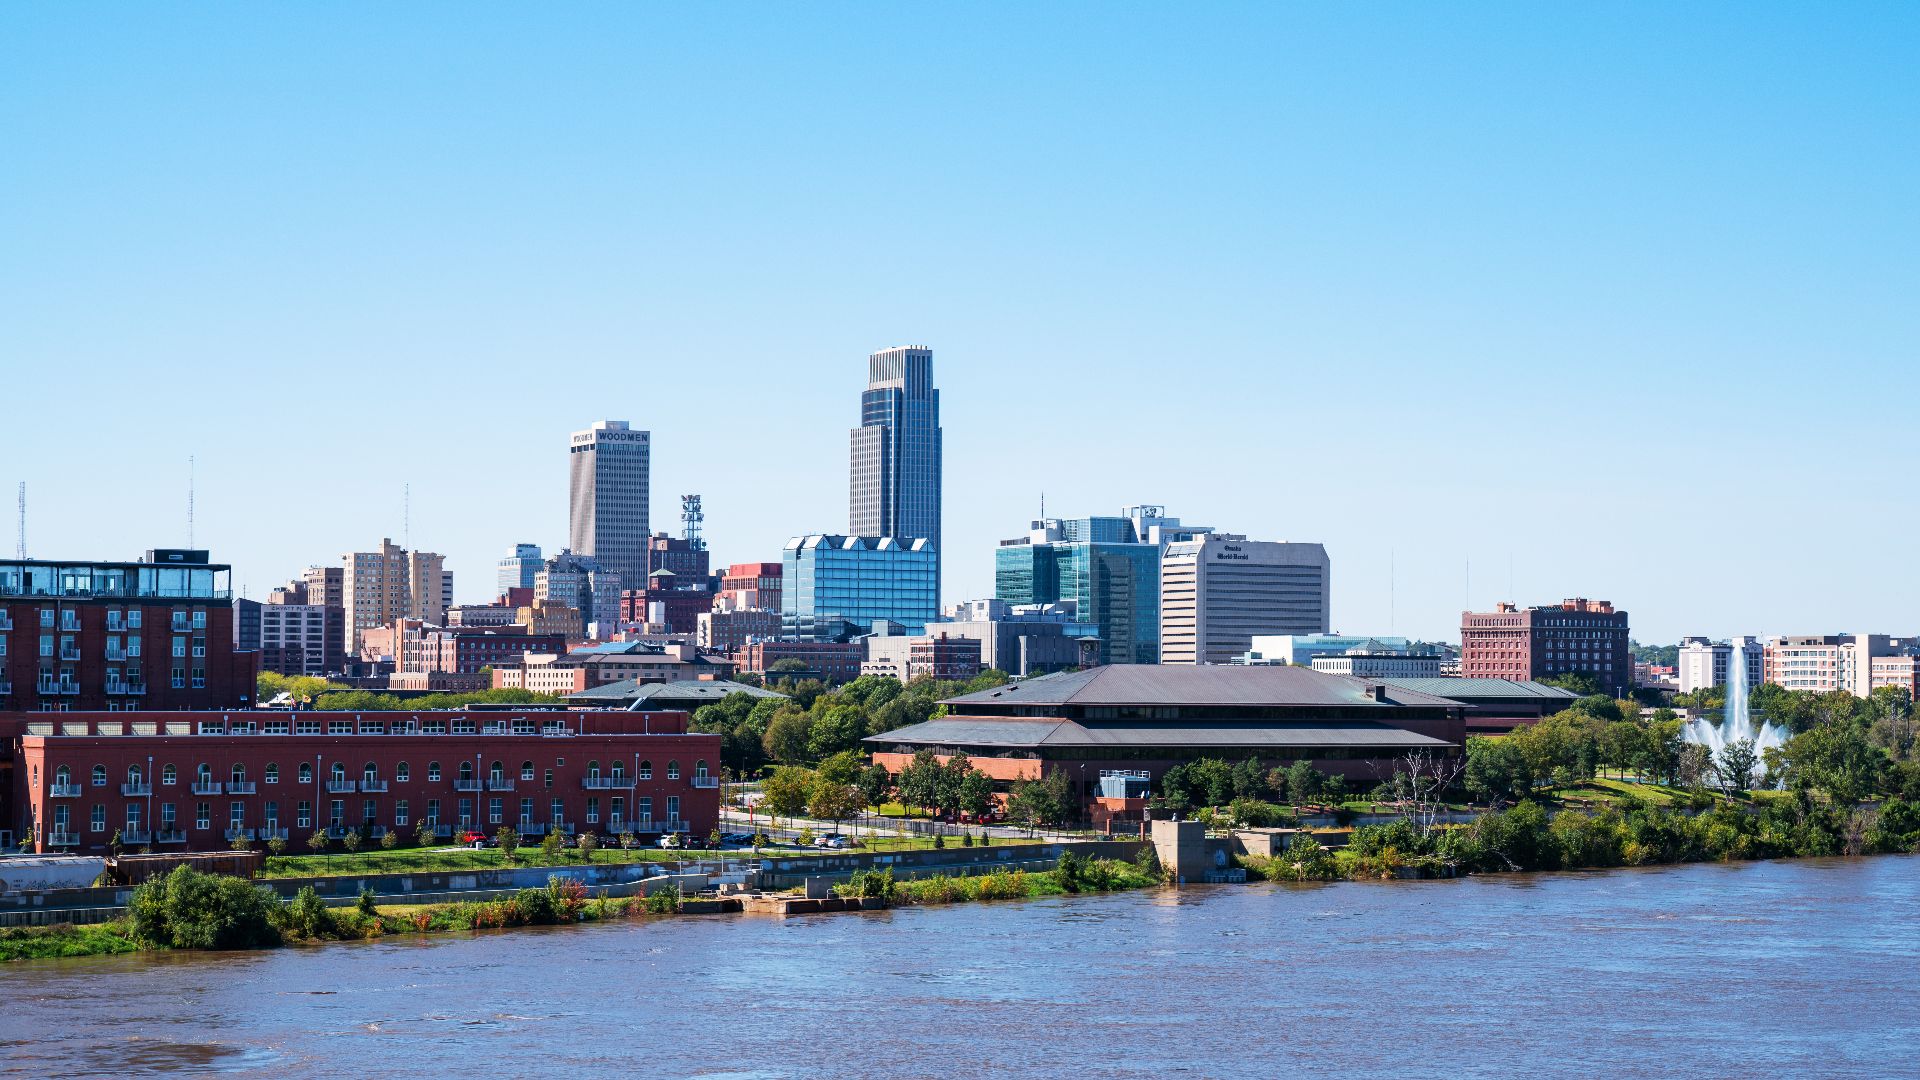
Omaha, Nebraska
What used to be known as an attainable Midwestern hub is tightening up fast. Locals may still find relative value here, but the comfort margin is shrinking quickly. Omaha’s homes now average $274,713 against incomes of roughly $70,000, a 3.9x gap that’s expanding each year.
 Tony Webster from Minneapolis, Minnesota, United States, Wikimedia Commons
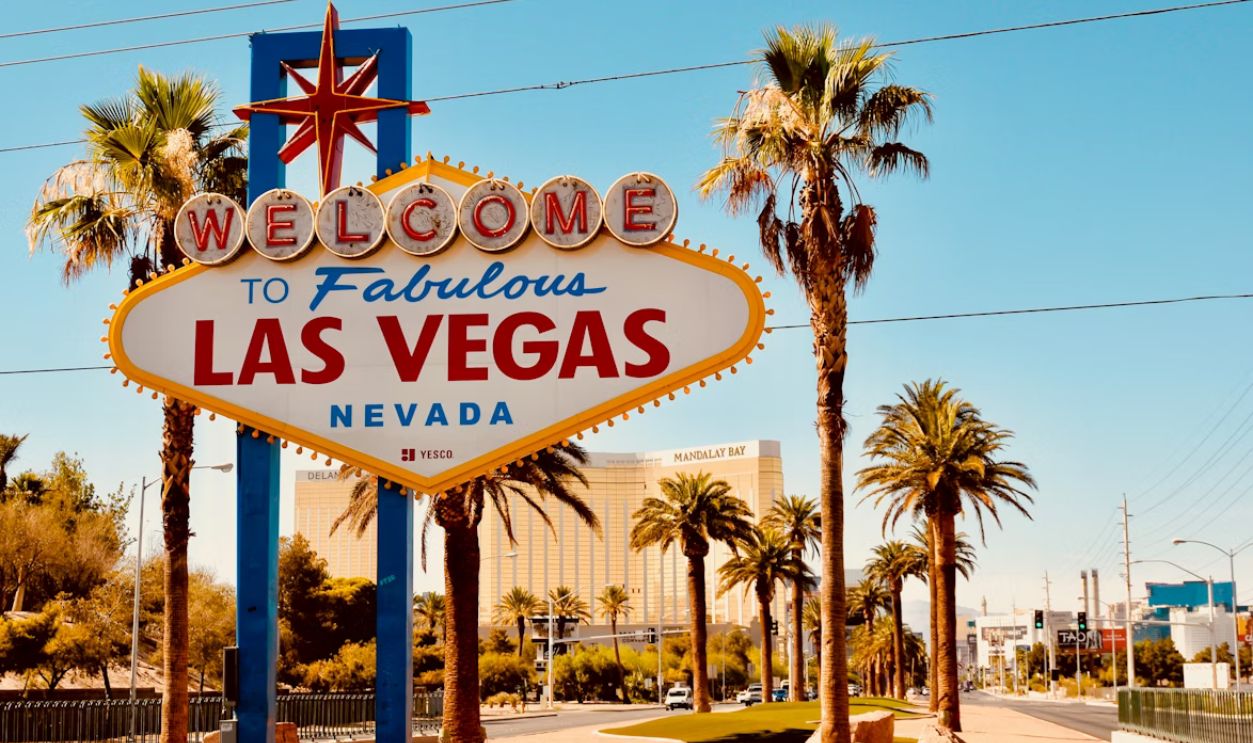
Las Vegas, Nevada
The glitz of Las Vegas doesn’t hide the reality of home ownership. Houses now cost roughly $436,200, yet incomes average only $66,356. That 6.6x ratio reflects how soaring demand and limited supply have made housing access one of Sin City’s biggest bets to lose.
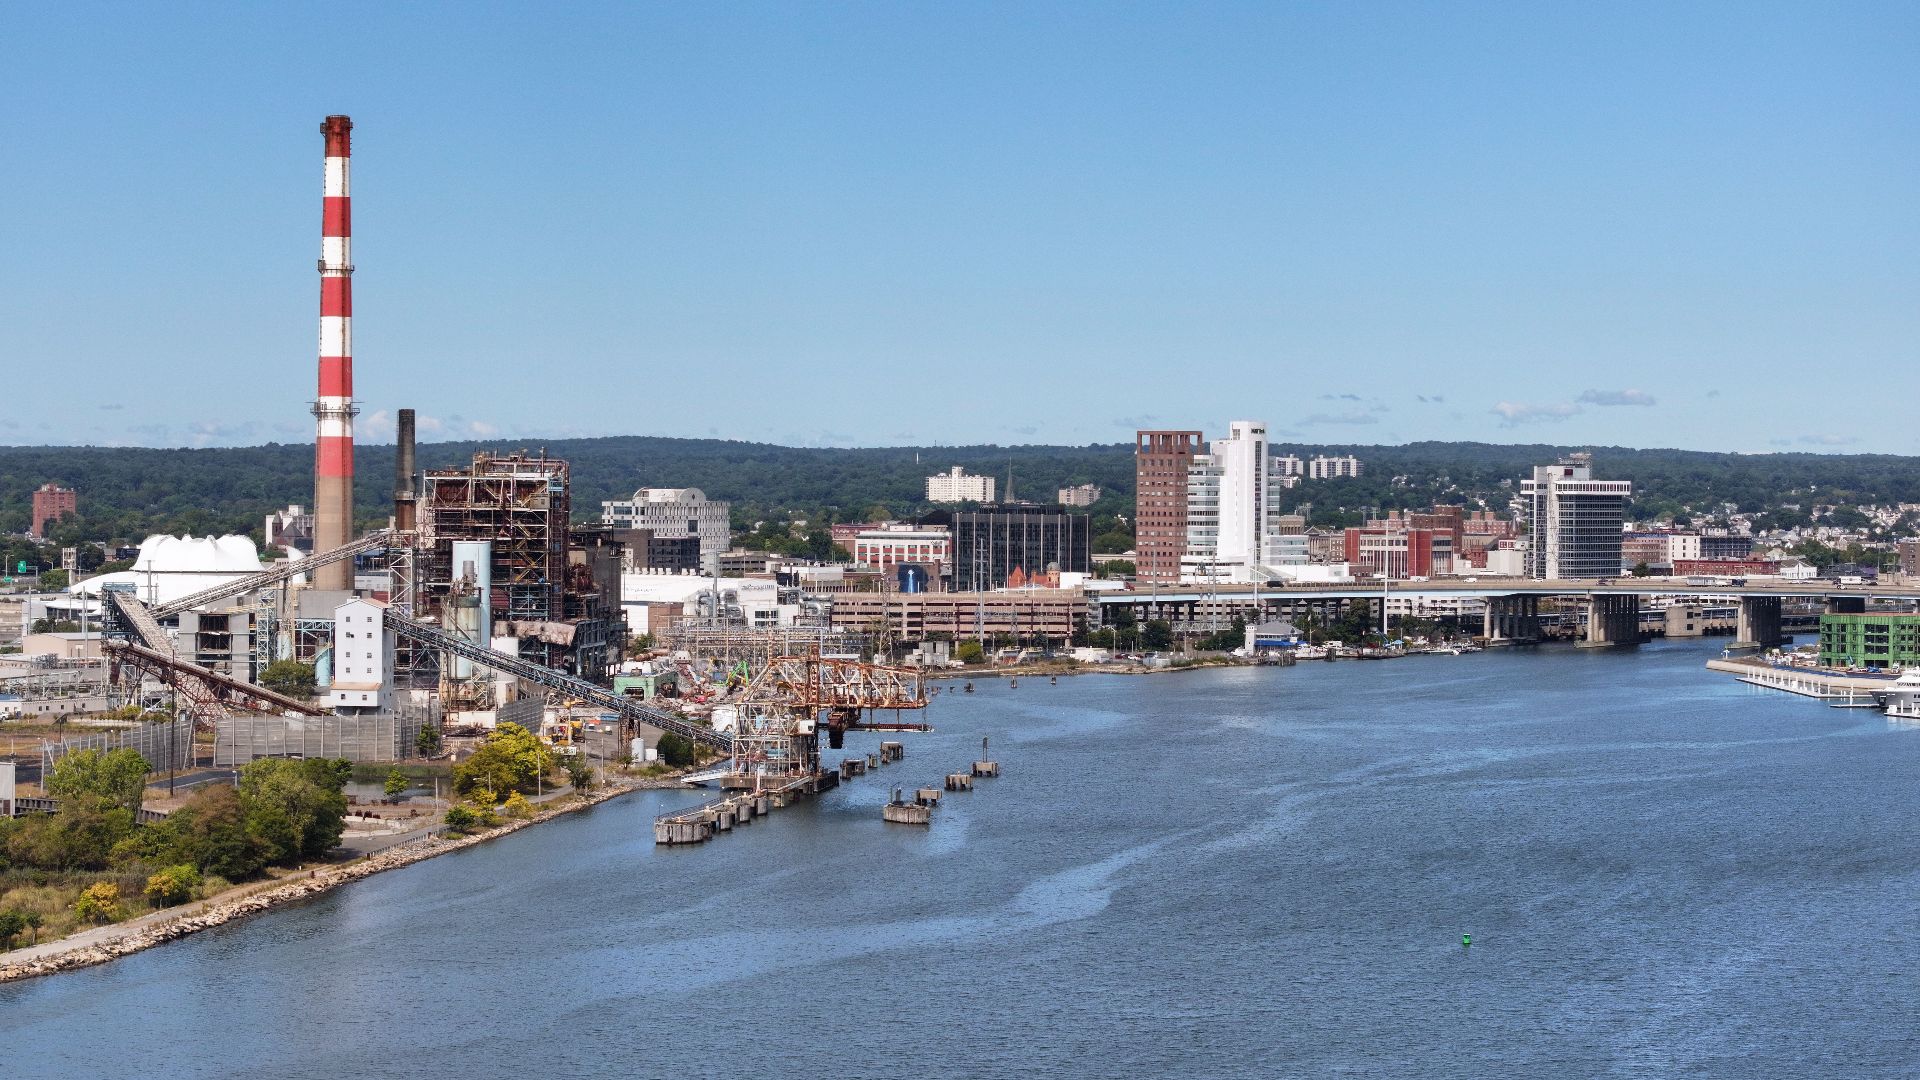
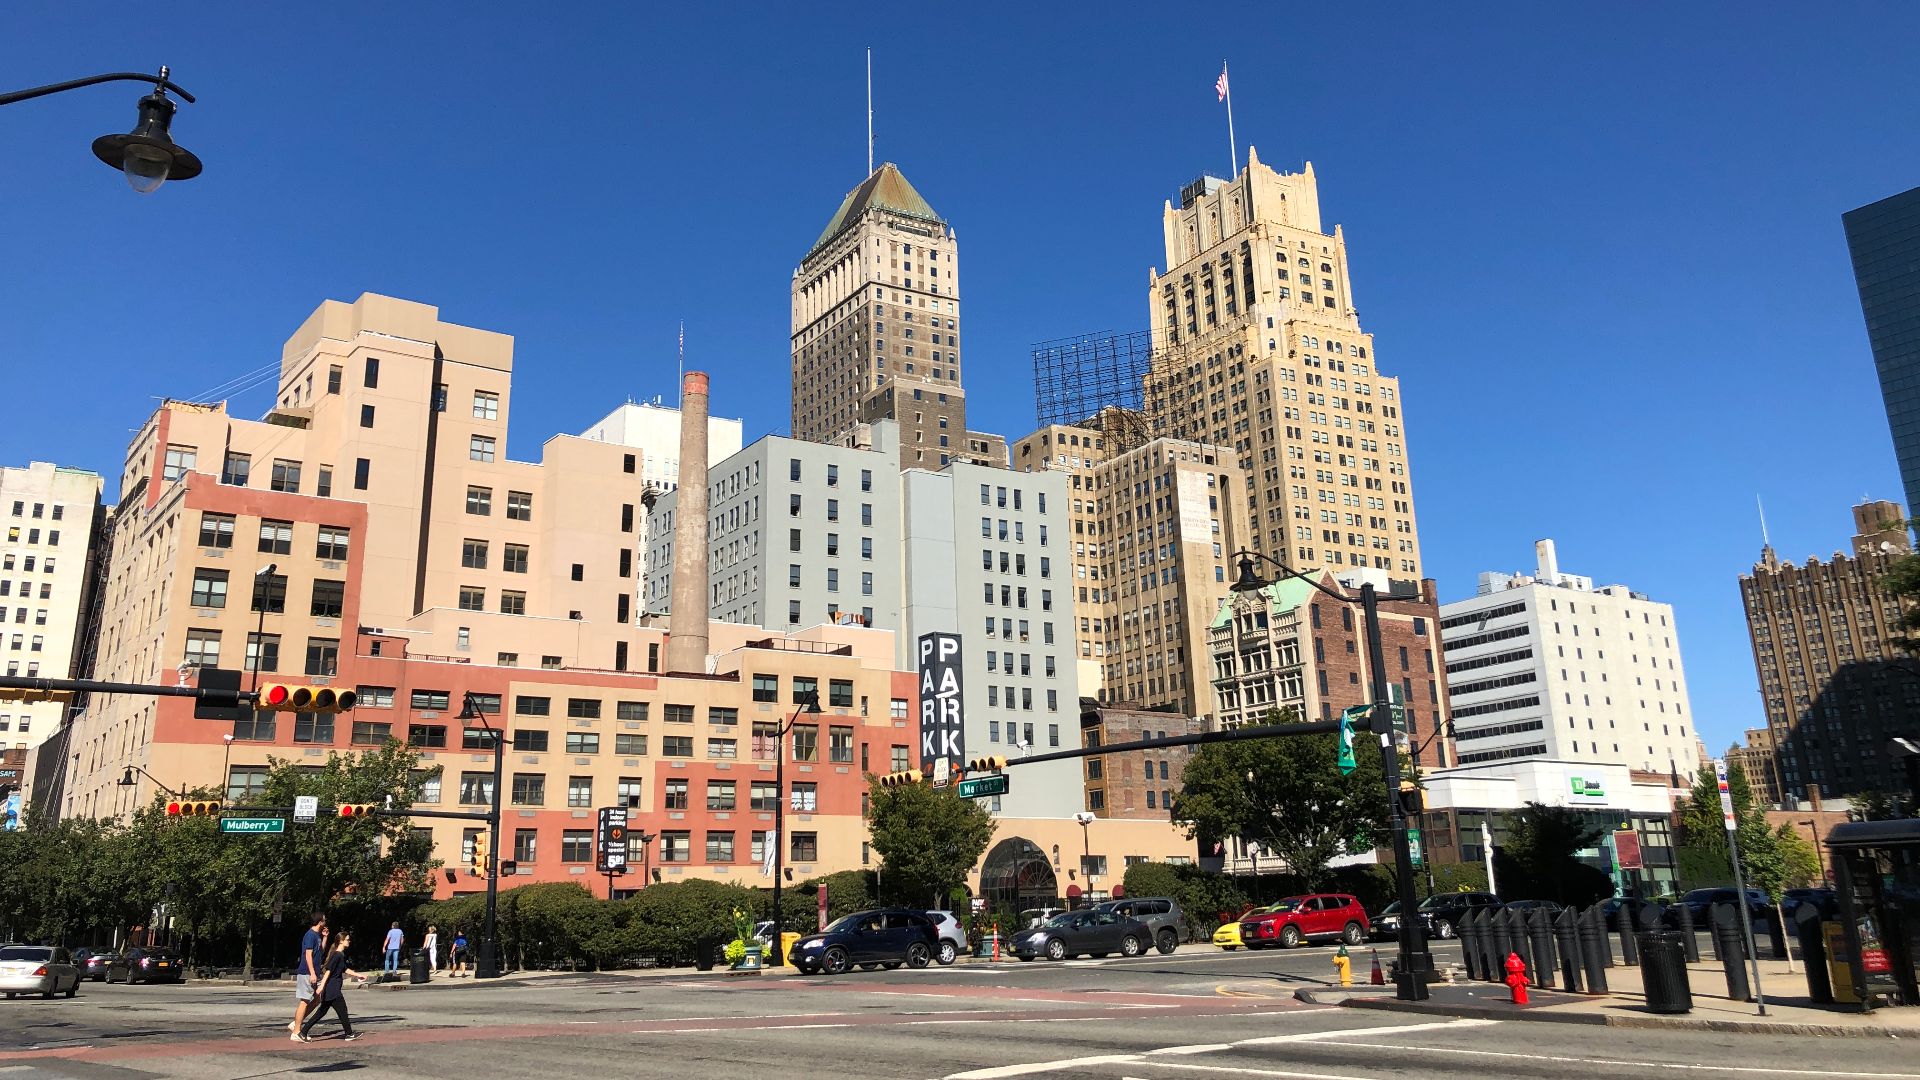
Newark, New Jersey
Owning a dwelling in Newark has become nearly impossible for most residents, even as the city grows culturally and economically. With prices near $485,670 and a median income of just $48,416, the ratio reaches a staggering 10.0x.
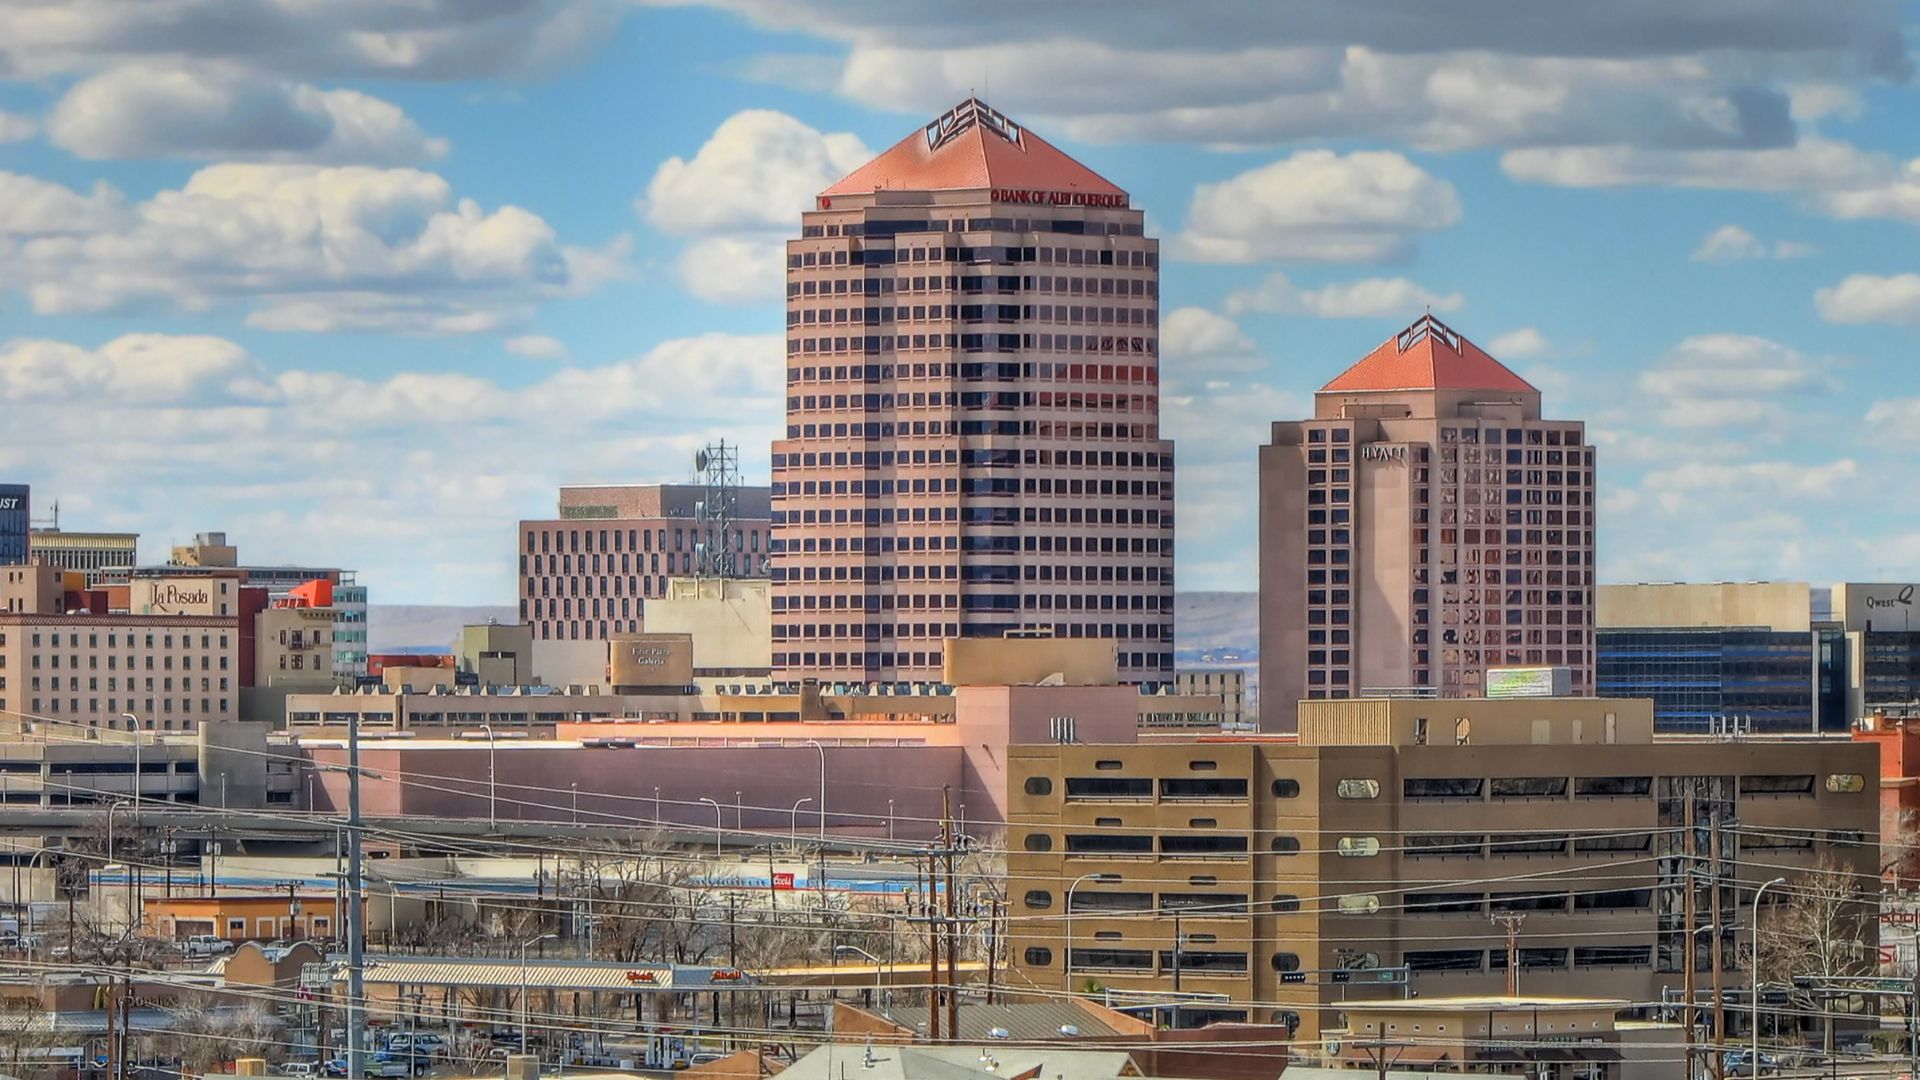
Albuquerque, New Mexico
Bright skies and desert charm can’t hide Albuquerque’s gap. Homes average about $316,766, compared to a median income of $61,503, giving it a 5.2x price ratio. For many locals, that means more renters and fewer first-time buyers in New Mexico’s largest city.
New York City, New York
In the city that never sleeps, home ownership dreams often stay just that—dreams. If you ask New Yorkers, sky-high real estate remains the city’s ultimate luxury. But with median prices near $808,970 and incomes averaging $79,713, the ratio stands at a staggering 10.2x, which makes it nearly impossible.
 Pedro Lastra, Wikimedia Commons
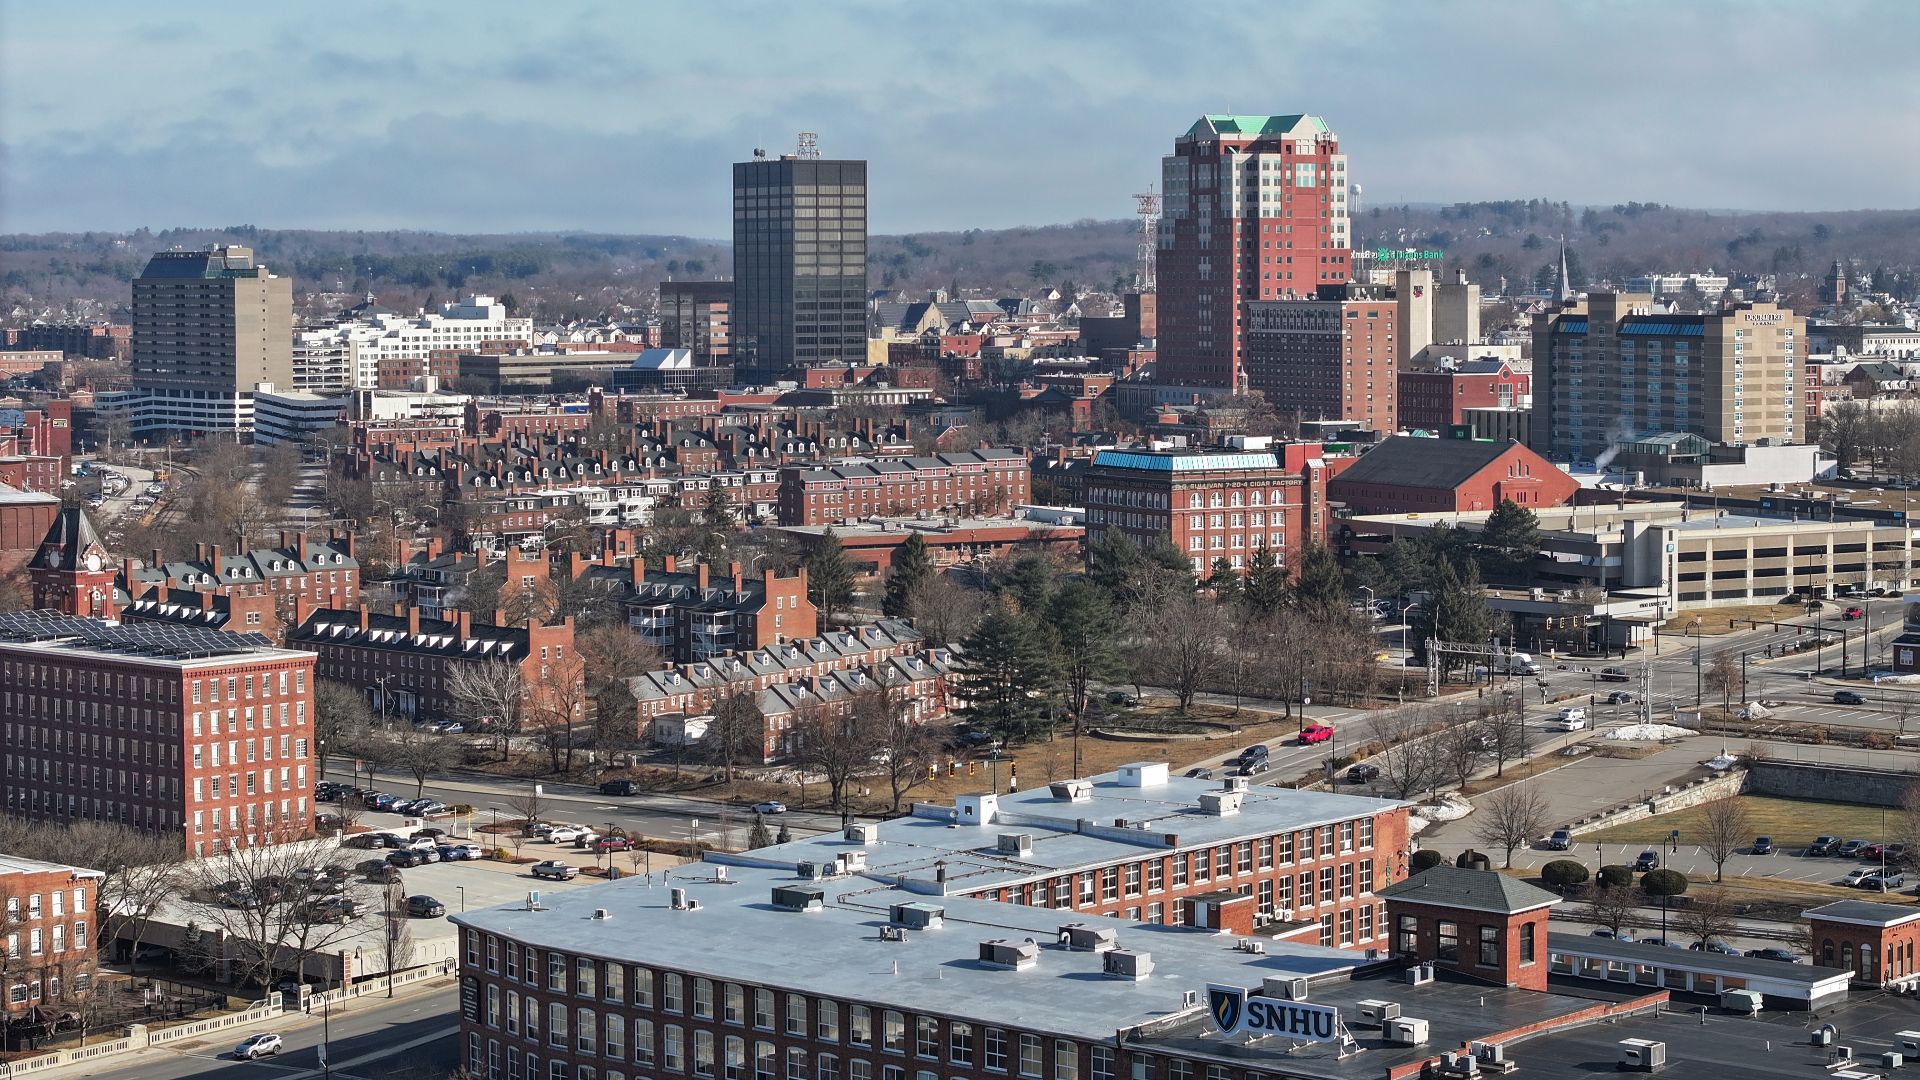
Manchester, New Hampshire
Manchester may be known for its industrial roots, but its home market feels anything but old-fashioned. Median home prices have climbed to $441,635, and incomes are $78,825. This 5.6x ratio has made New Hampshire’s largest city one of New England’s toughest spots for first-time buyers.
 Quintin Soloviev, Wikimedia Commons
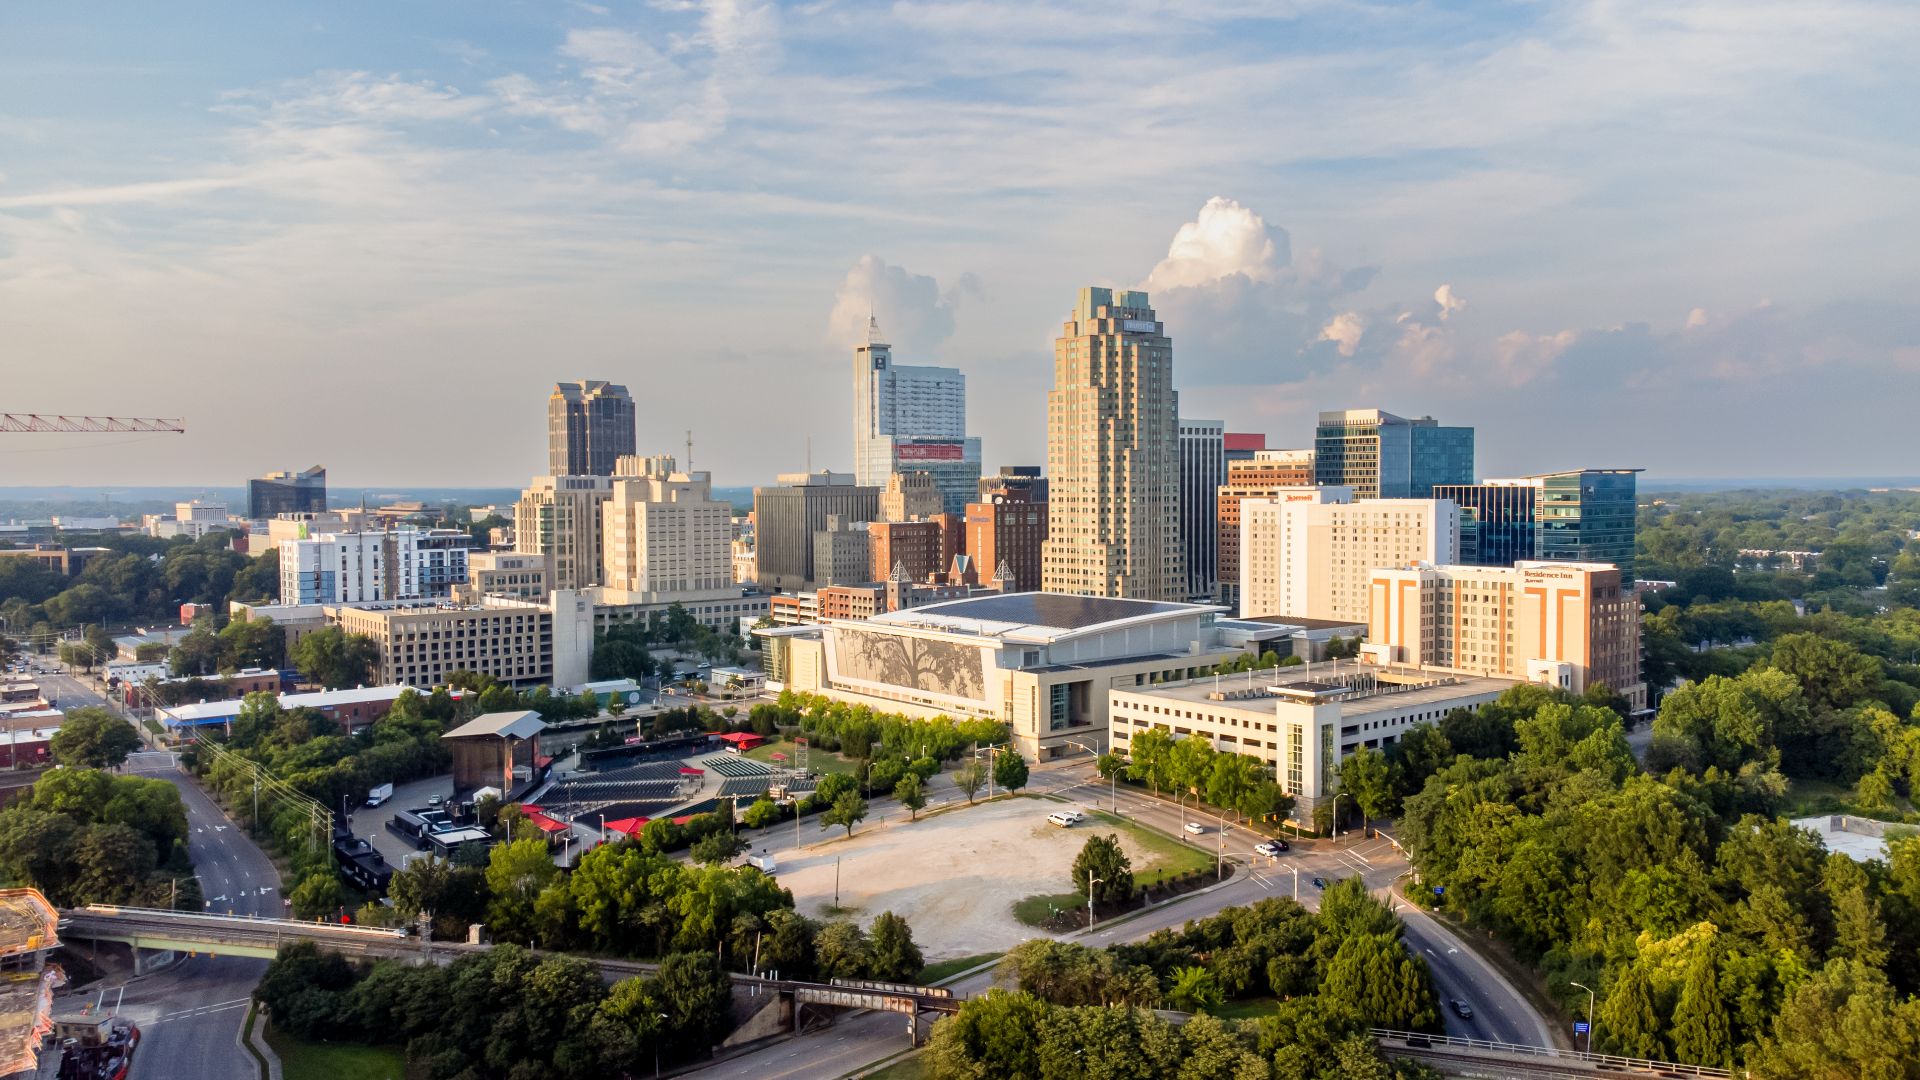
Raleigh, North Carolina
The city’s tech and research boom has drawn in talent, but the escalating property prices now challenge even its thriving professional class. Its homes average $431,344, and residents earn about $78,631 to create a 5.5x ratio.
 Abhiram Juvvadi, Wikimedia Commons
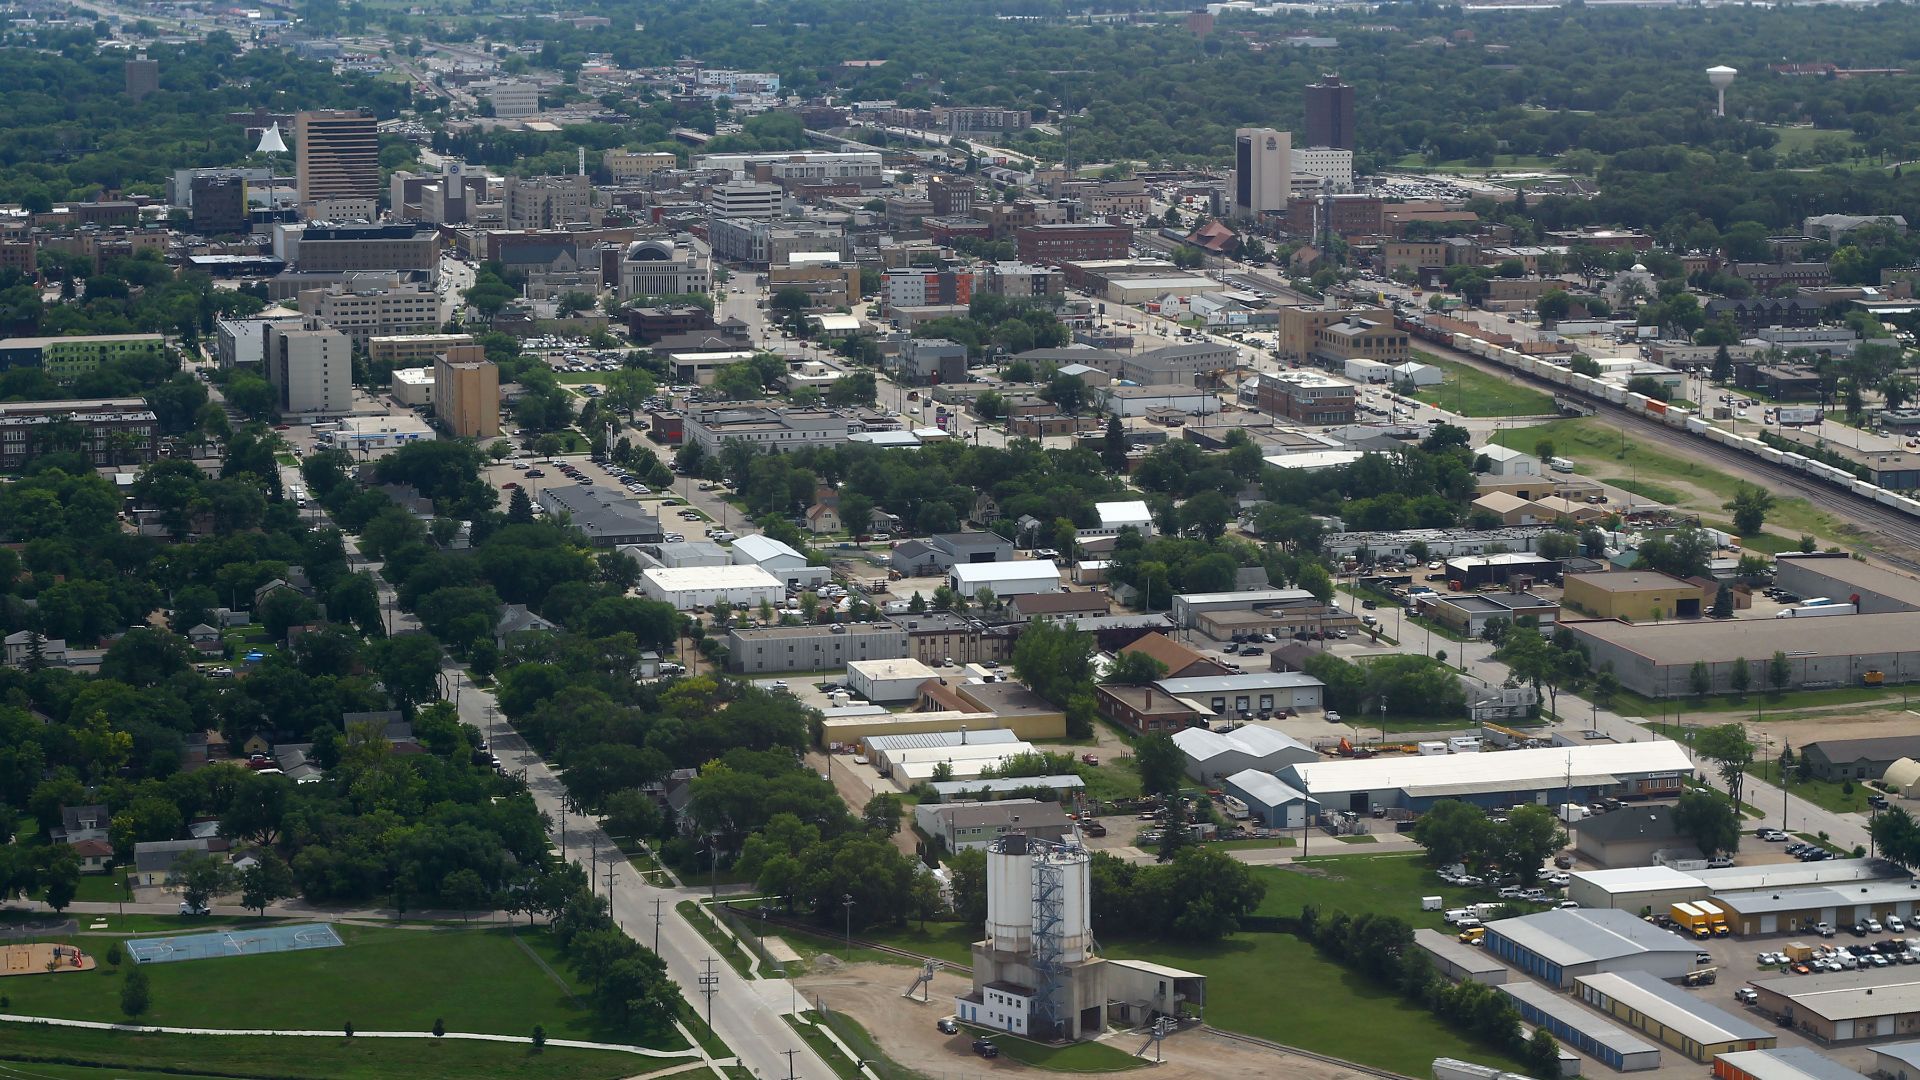
Fargo, North Dakota
Once considered comfortably accessible, Fargo’s real estate market has been climbing fast. A $291,493 median price versus a $64,432 income yields a 4.5x ratio. Population growth and limited new construction are steadily pushing this northern city toward tighter conditions.
 formulanone, Wikimedia Commons
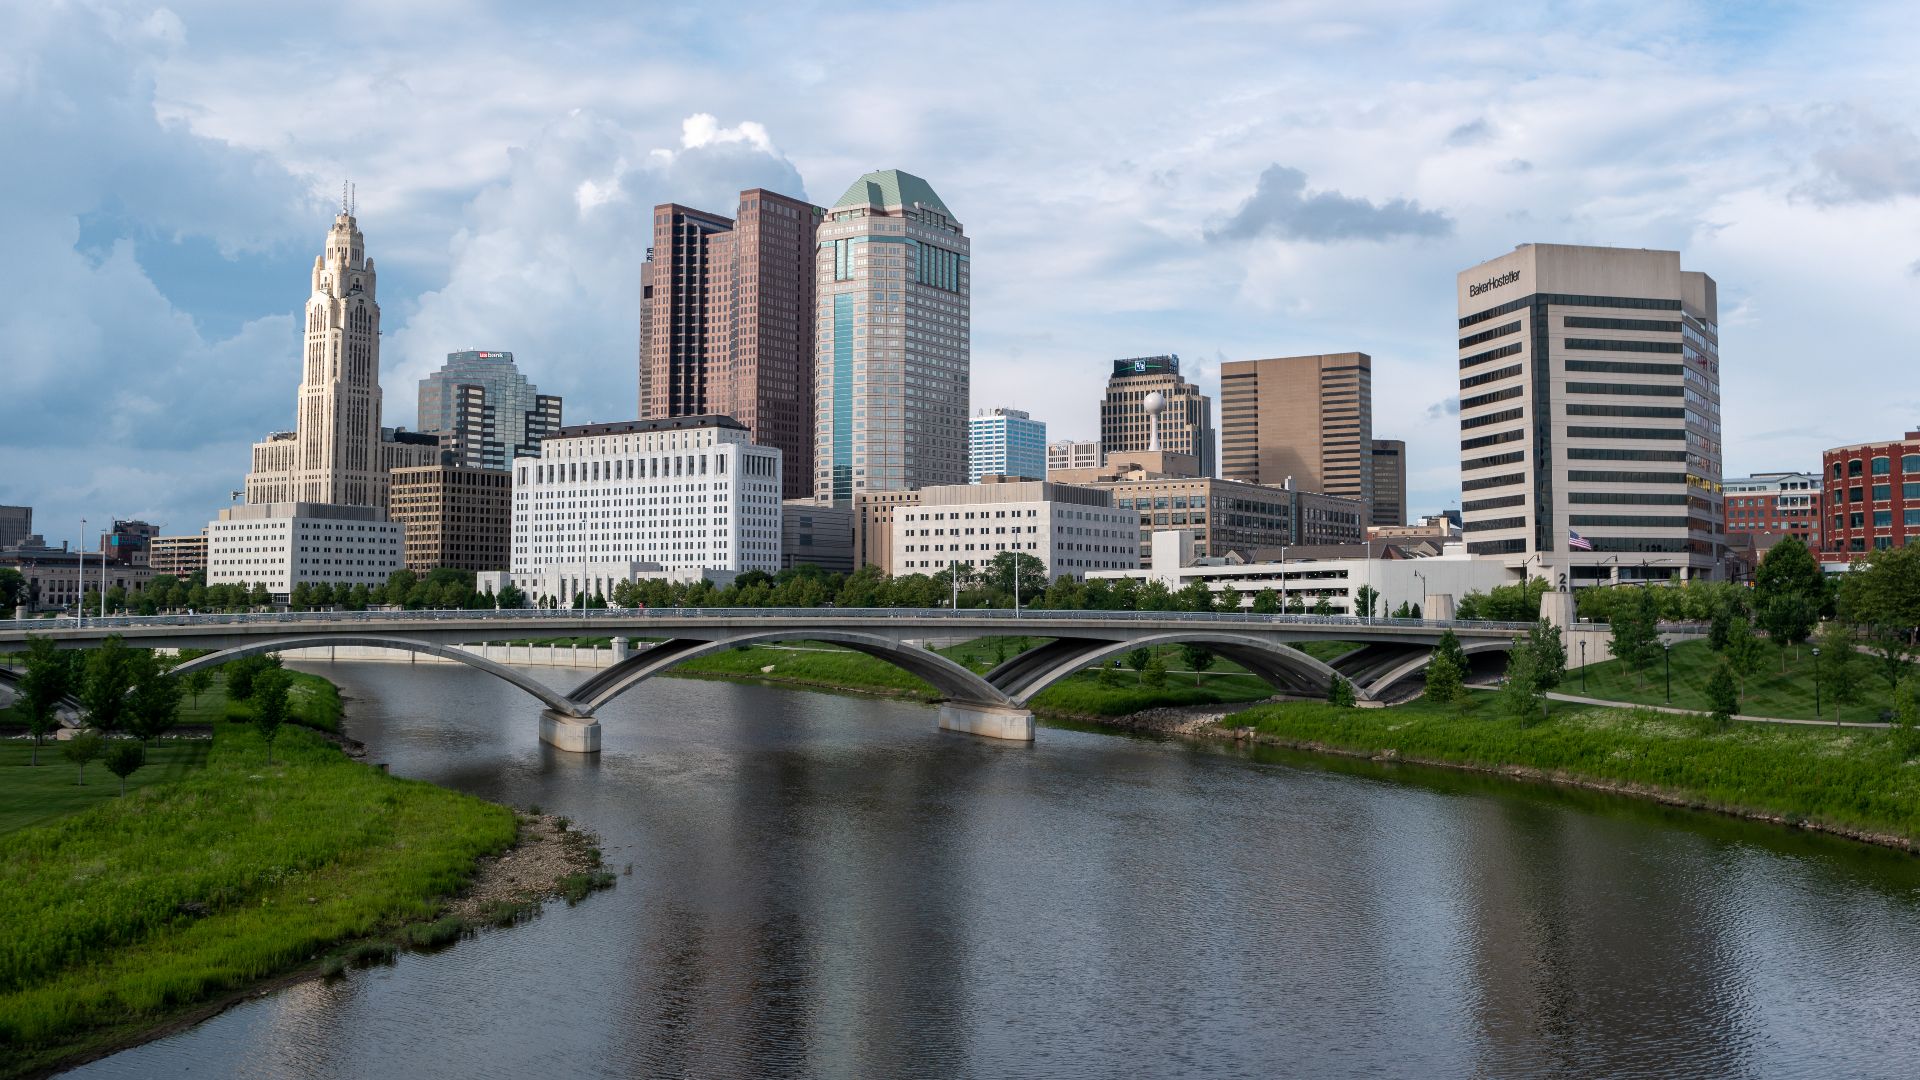
Columbus, Ohio
Dwellings in Columbus average $240,278, compared with local earnings of $62,350. The resulting 3.9x ratio marks a turning point for Ohio’s capital, which once ranked among the nation’s most attainable markets. Rising prices now place steady pressure on mid-income buyers.
 Paul Wasneski, Wikimedia Commons
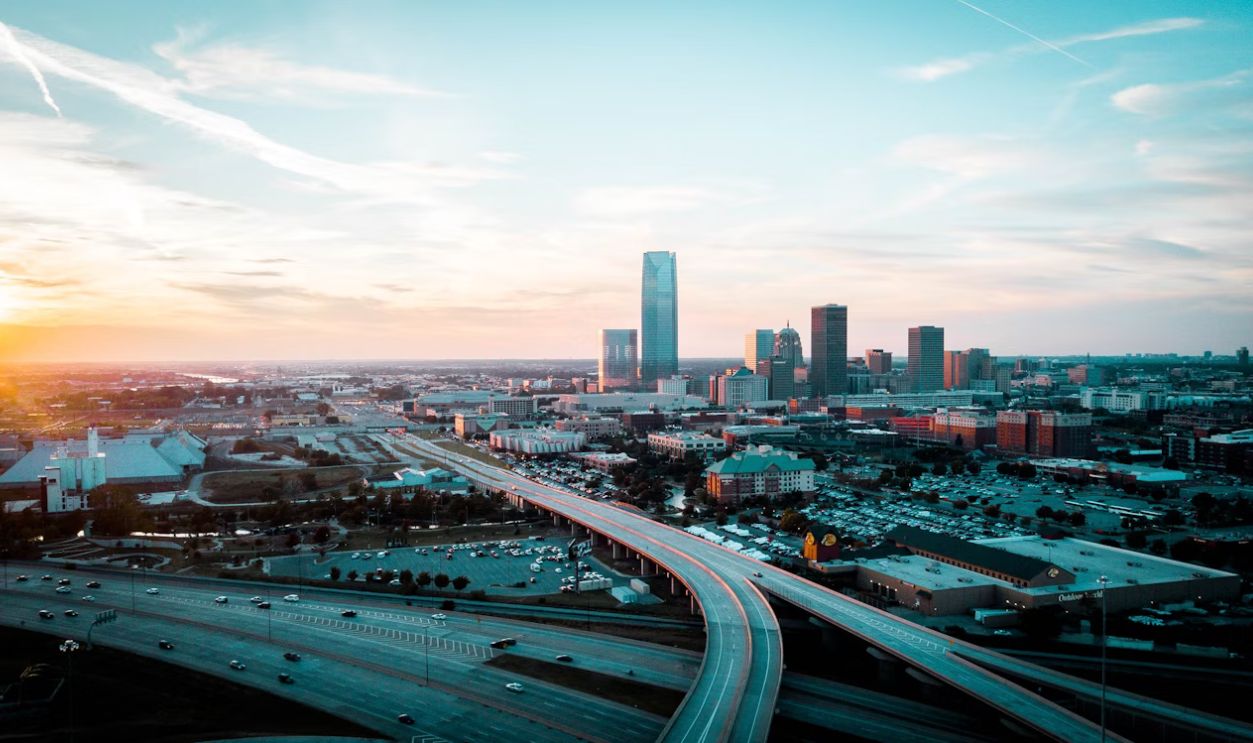
Oklahoma City, Oklahoma
Oklahoma City still offers a better deal than many metros, but the prices are rising fast. Its expanding economy is attracting buyers faster than it can build, pushing home affordability downward. Homes typically sell for $199,133, even as incomes average $64,251, resulting in a ratio of about 3.1x.
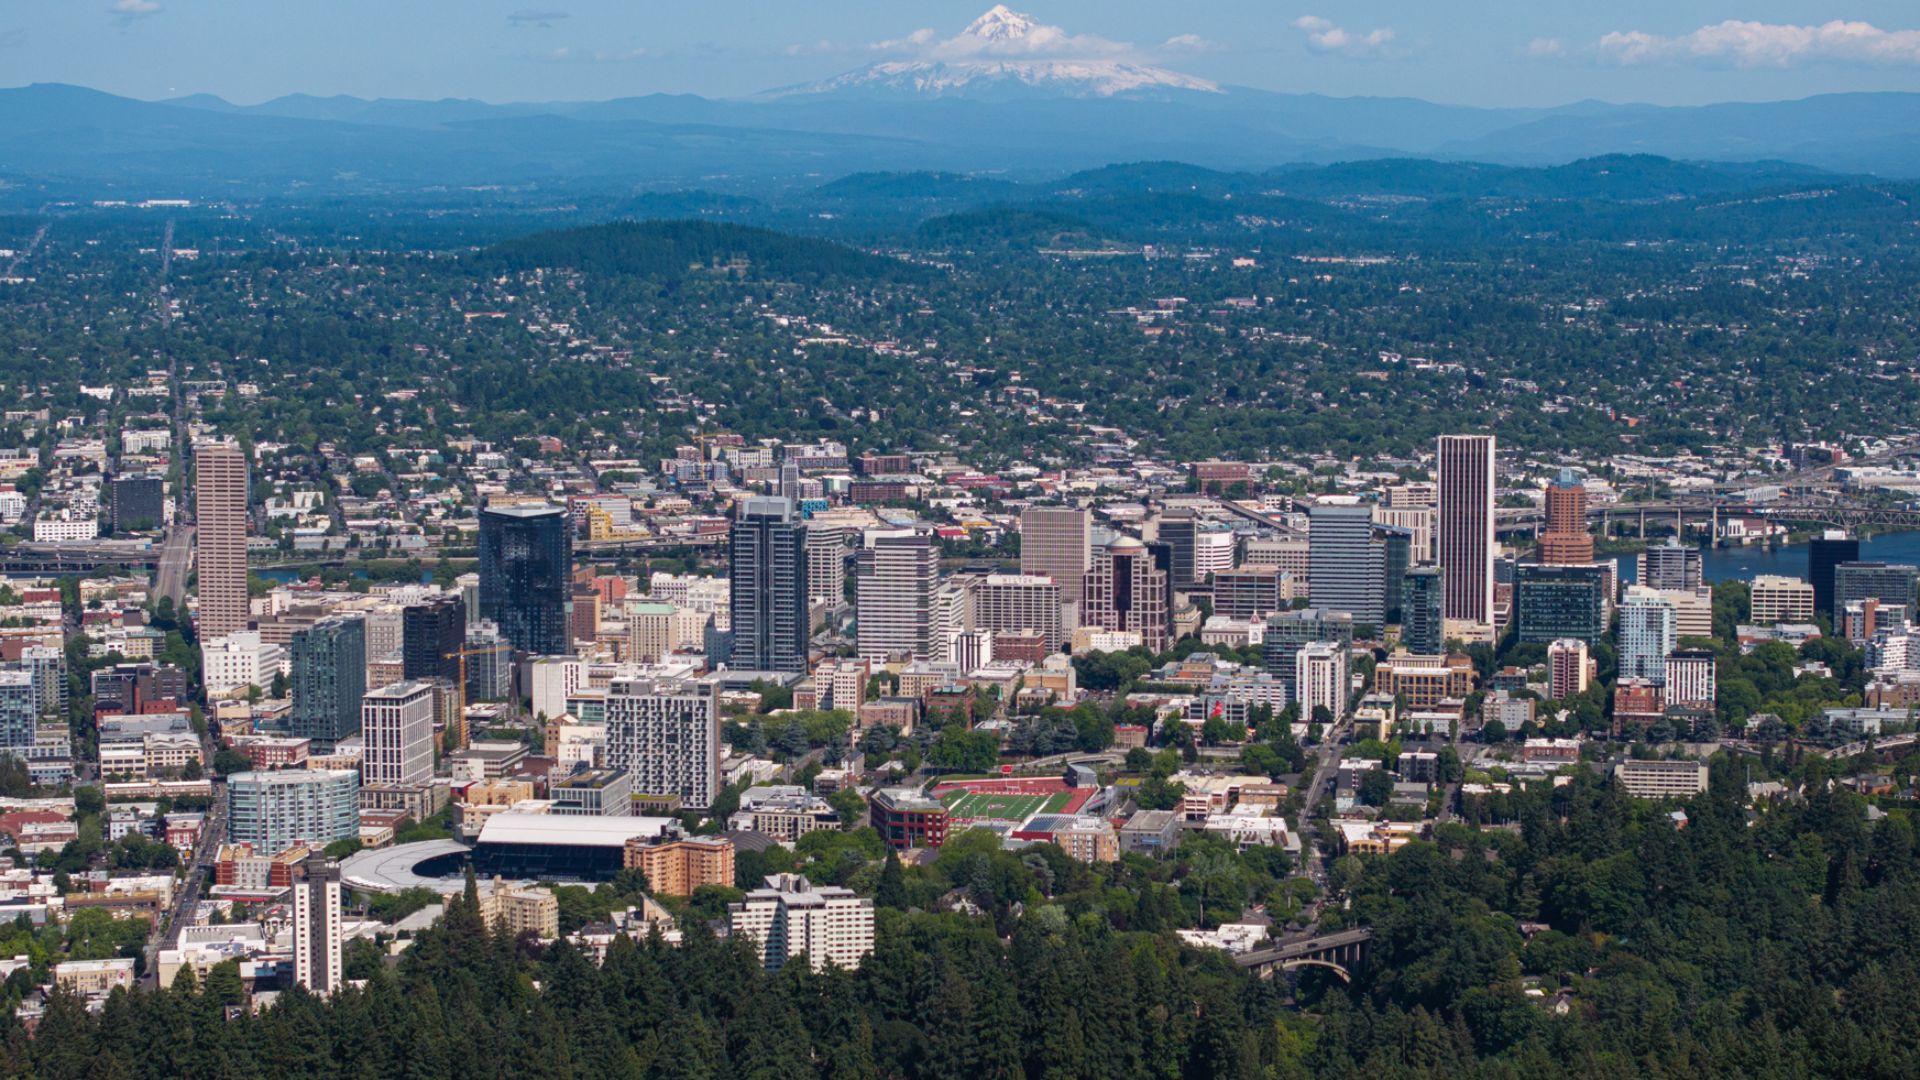
Portland, Oregon
Portland’s creative spirit hasn’t protected it from an accessibility crunch. The median home price is around $546,302. Its local incomes average $88,792, and this yields a 6.2x ratio. As demand for Pacific Northwest living keeps climbing, residents face increasingly steep prices just to stay rooted.
 Spicypepper999, Wikimedia Commons
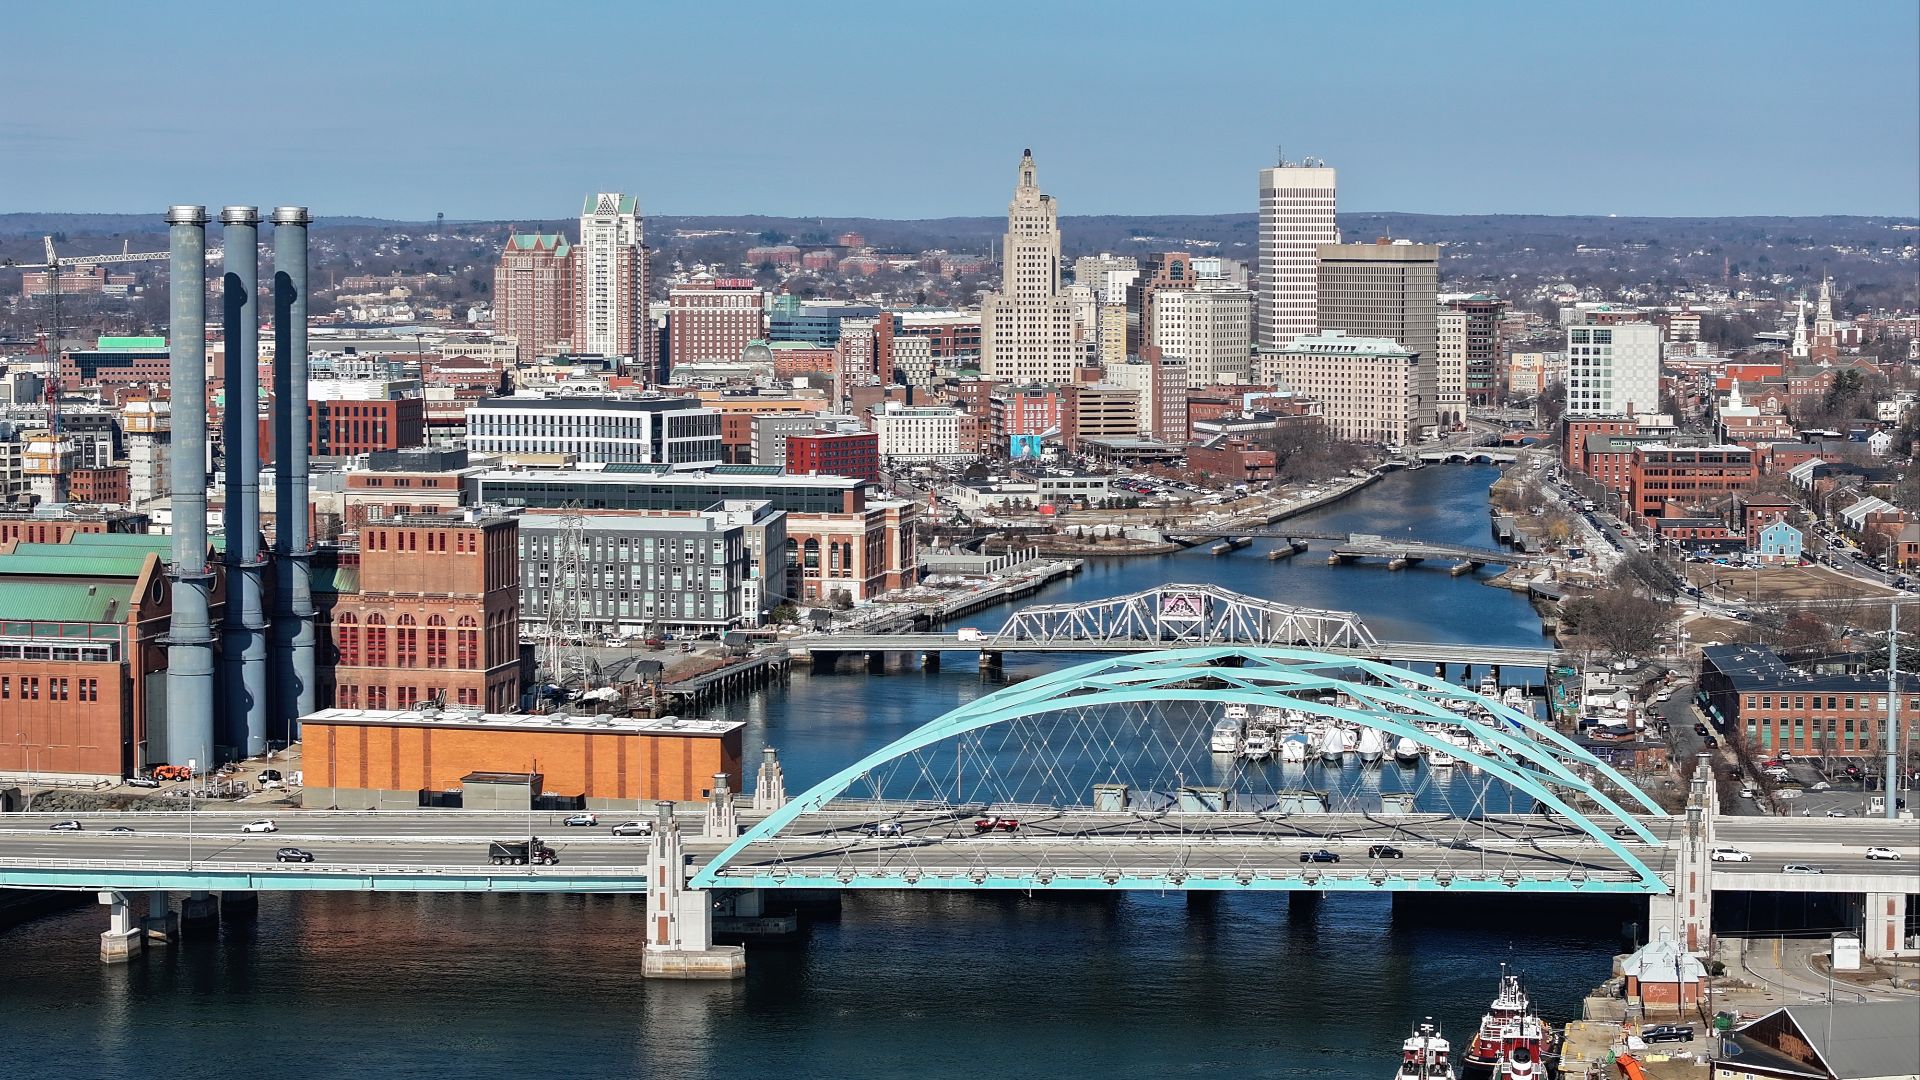
Providence, Rhode Island
Here in New England’s creative capital, homes cost roughly $362,325, paired with median earnings of $72,700, which gives a 5.0x ratio. Despite that, Providence’s vibrant arts scene and Ivy League presence still make it an attractive, but costly, place to live.
 Quintin Soloviev, Wikimedia Commons
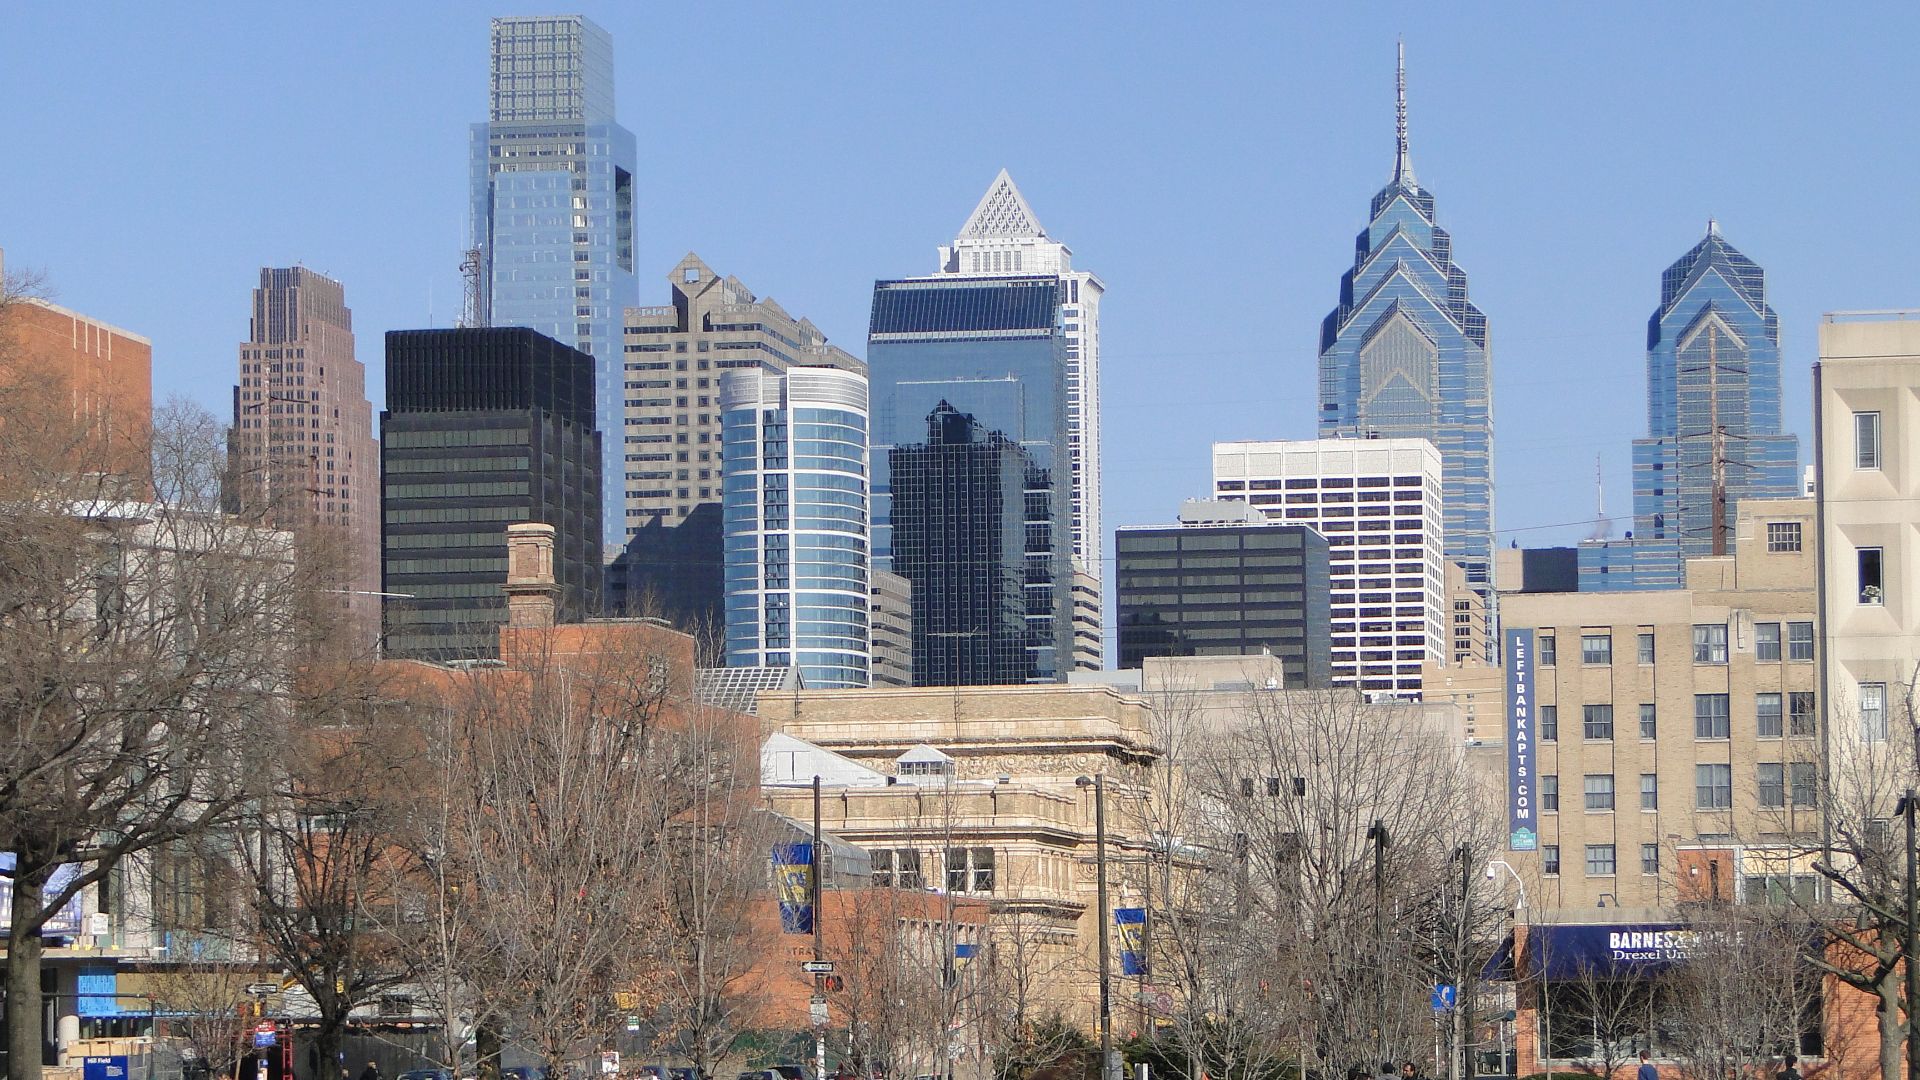
Philadelphia, Pennsylvania
Historic streets and rowhouses hide a gap. As prices rise faster than wages, even lifelong residents find owning in the City of Brotherly Love increasingly out of reach. A typical home costs around $221,032, and the average $57,537—about 3.8 times lower.
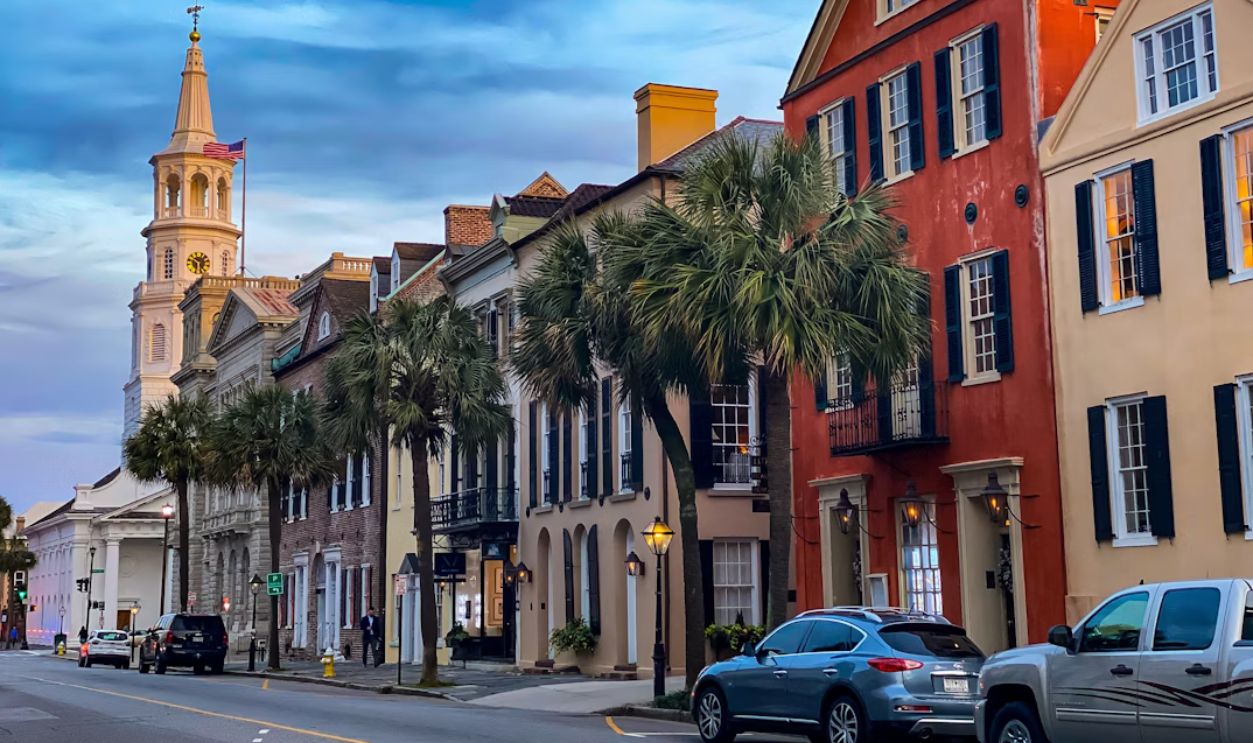
Charleston, South Carolina
Charleston’s southern charm comes with a steep price tag. The median home now costs $525,534, compared to incomes averaging $90,038. The 5.8x ratio reflects the city’s growing popularity, as tourism and relocation trends drive up prices.
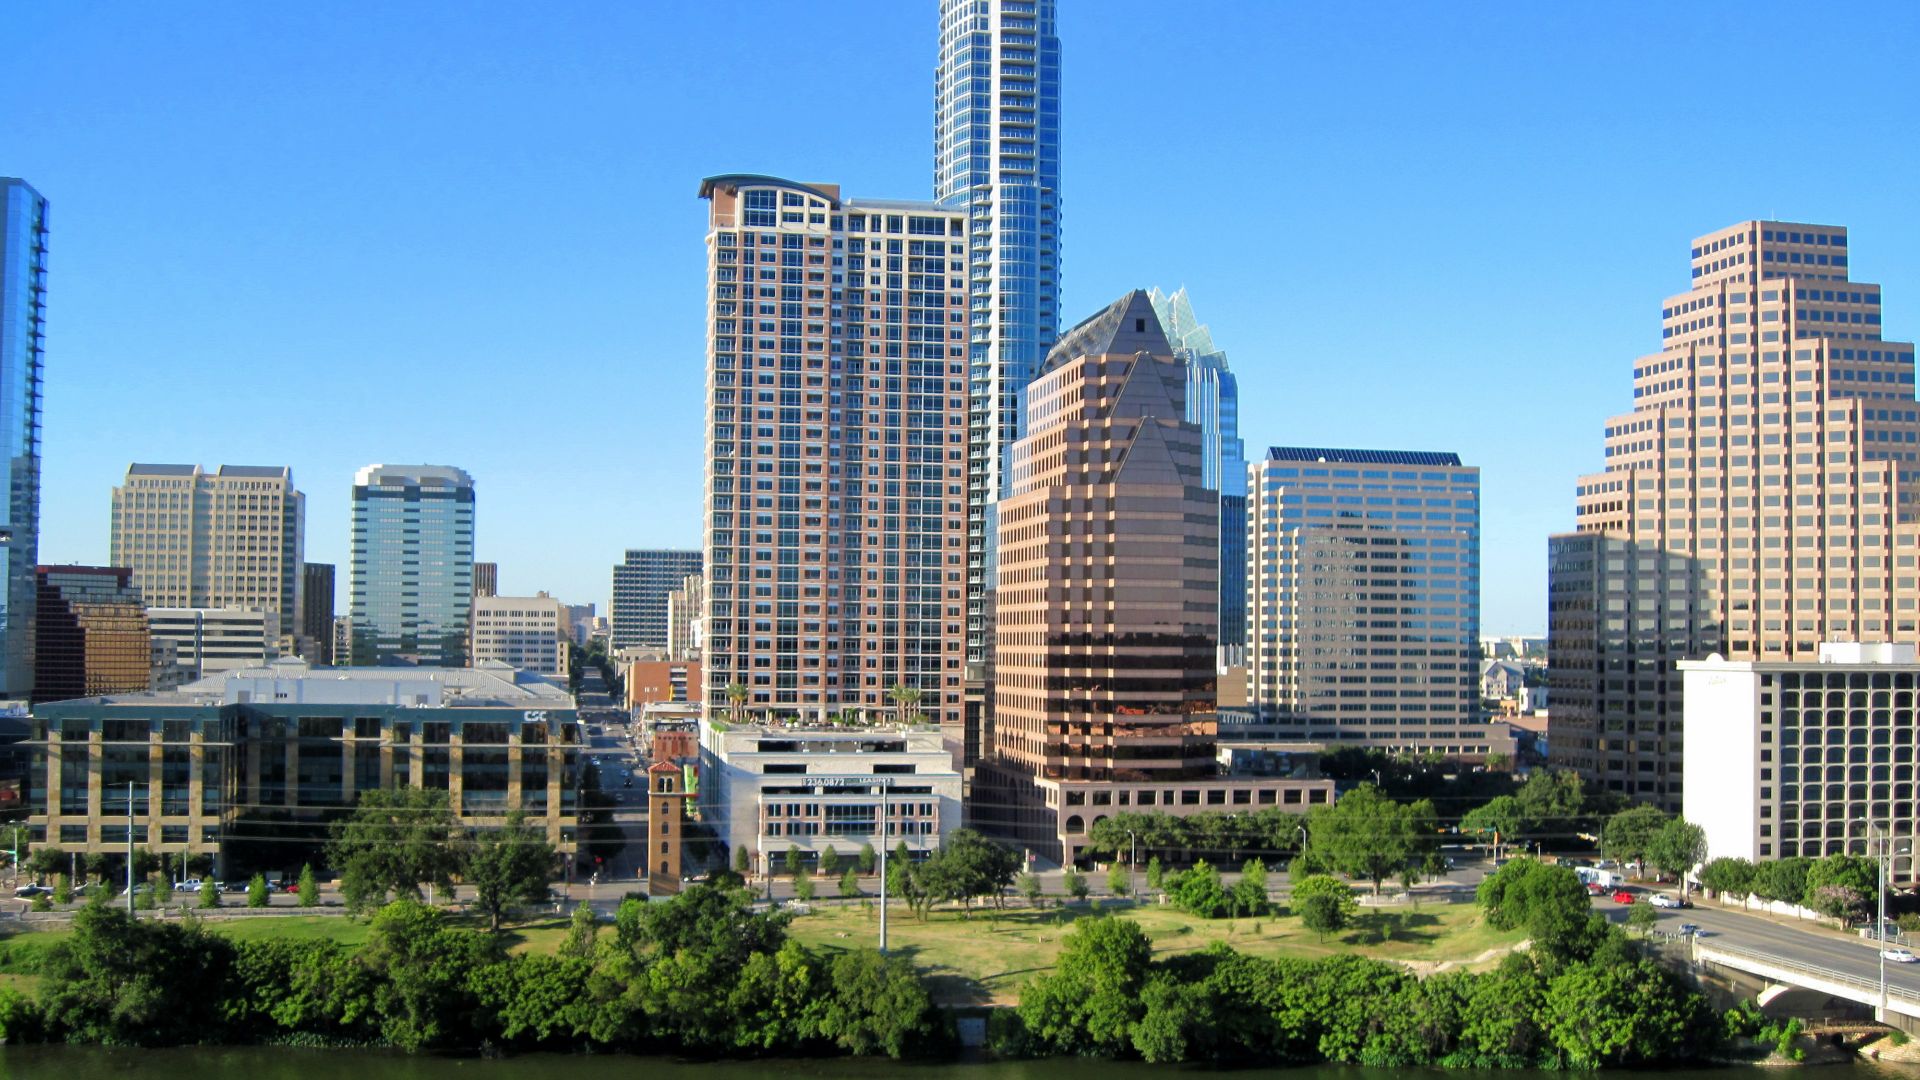
Austin, Texas
Austin’s boom brings excitement and headaches. Homes sit at $512,937, incomes at $89,633, which creates a 5.7x divide. Rising demand fuels the city’s spirit but leaves many residents feeling squeezed by one of Texas’s least accessible markets.
 Stuart Seeger, Wikimedia Commons
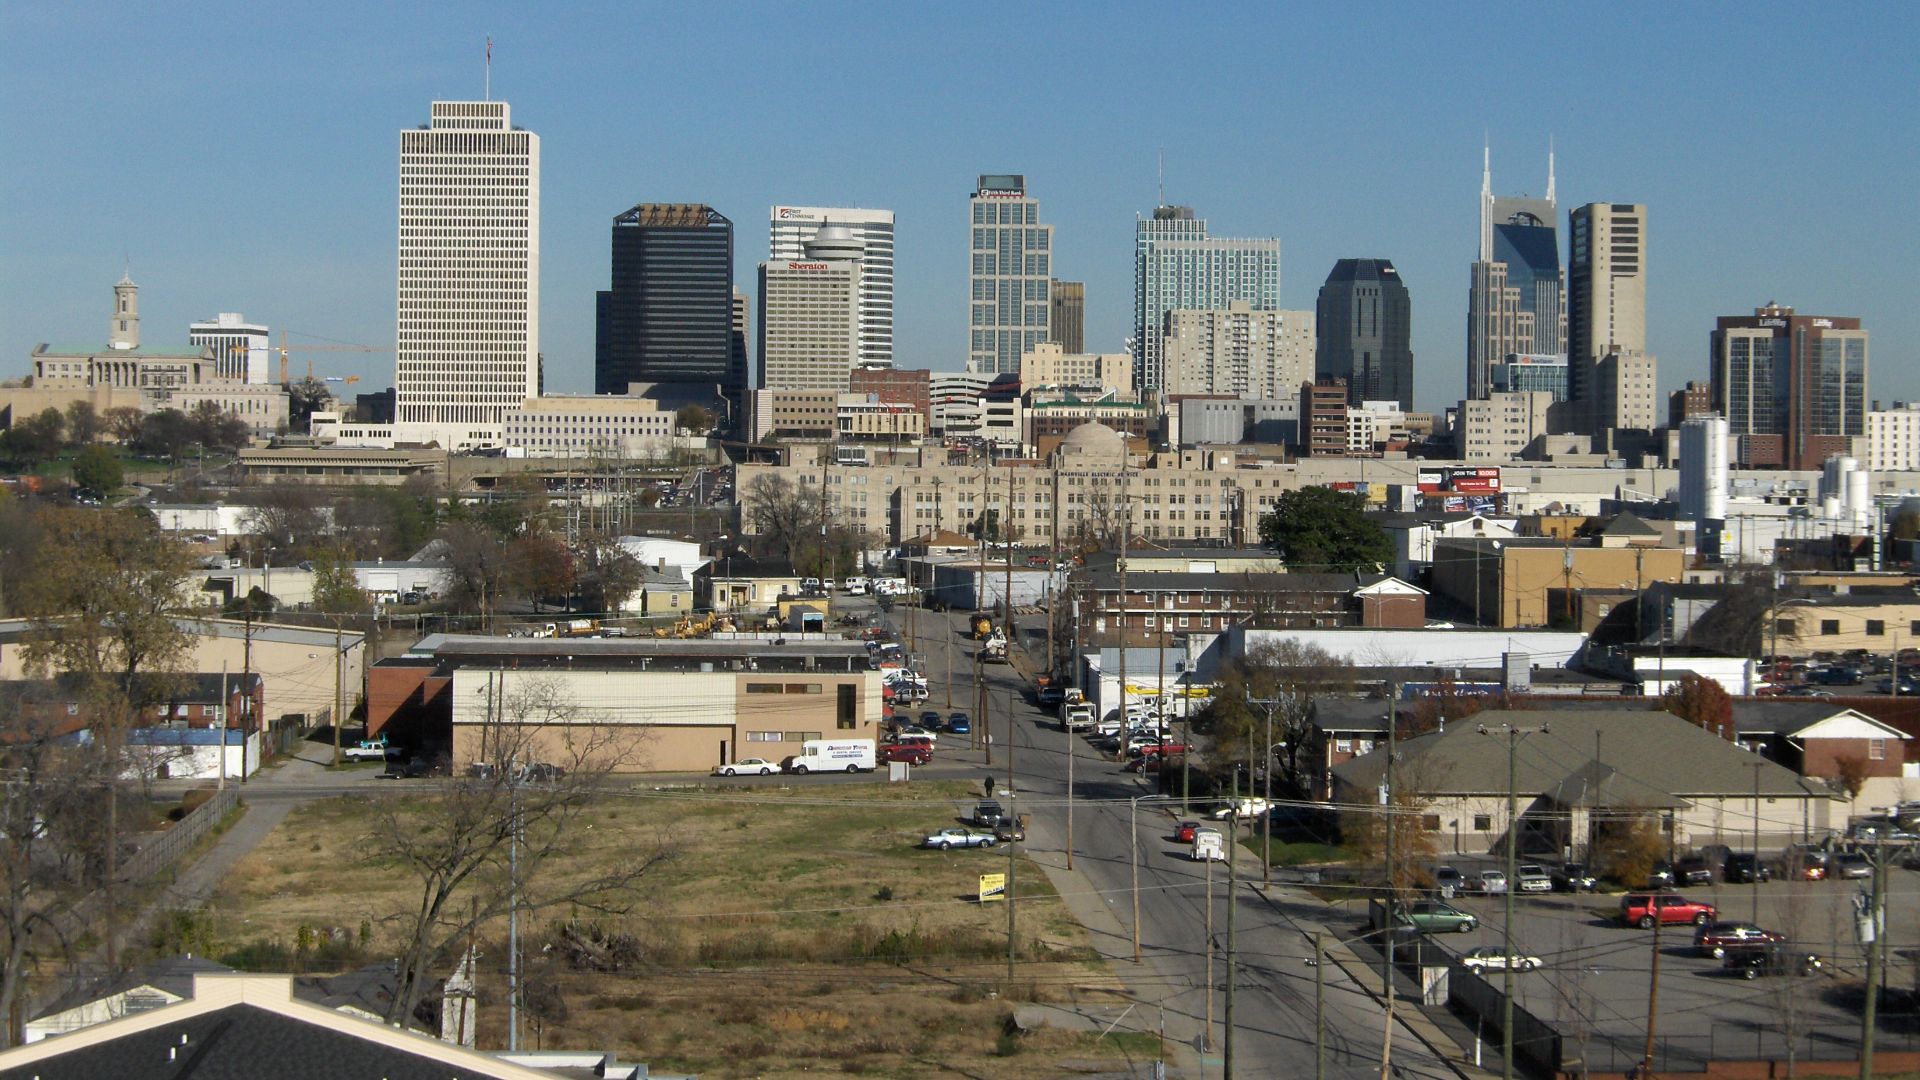
Nashville, Tennessee
The rhythm of Nashville’s real estate market is hitting a higher note. With homes averaging $423,694 and incomes around $75,200, the 5.6x ratio exposes how booming demand has outpaced local earnings. The city’s growth may be music to investors, but not to struggling buyers.
 Anonymous615, Wikimedia Commons
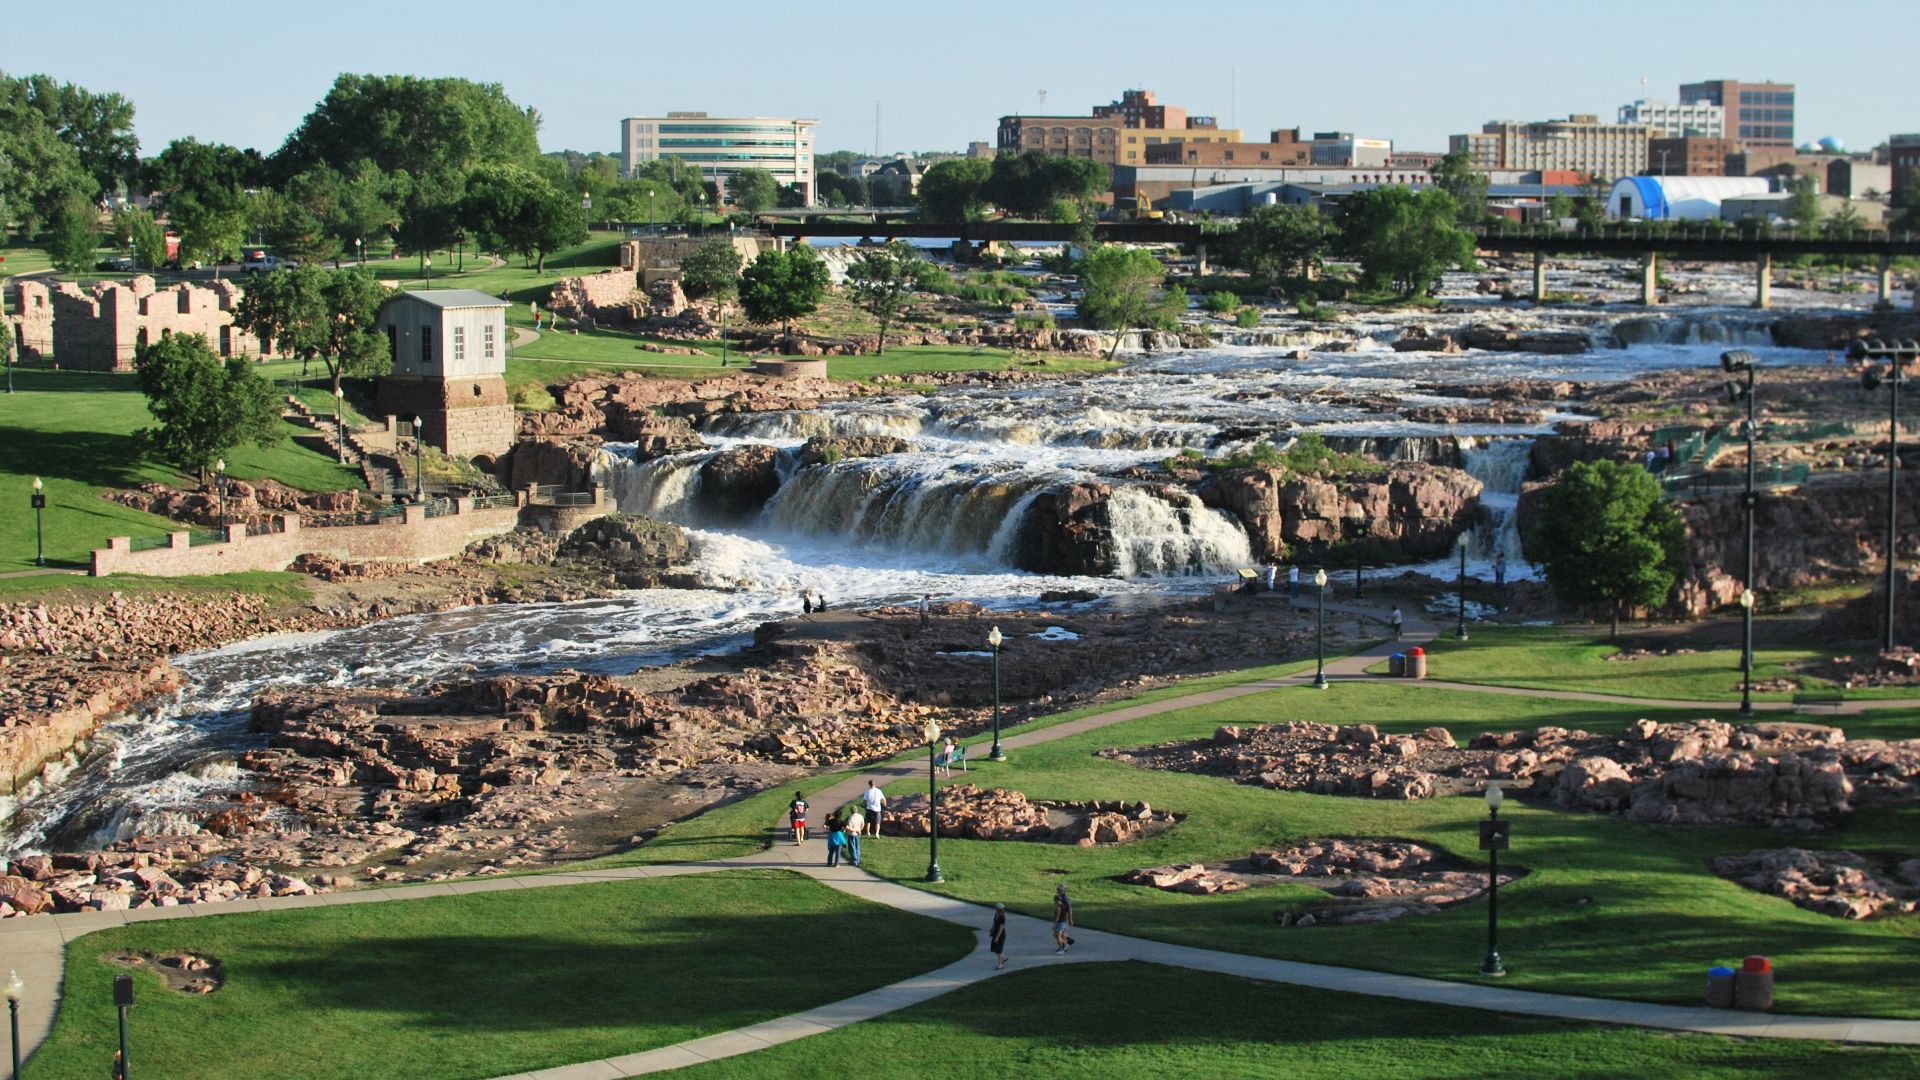
Sioux Falls, South Dakota
Once praised for its property access, South Dakota’s largest city now finds itself wrestling with higher prices and tighter inventory. Even in the Great Plains, expenses are climbing. Sioux Falls homes average $313,960, and the incomes reach $74,714, which makes a 4.2x ratio.
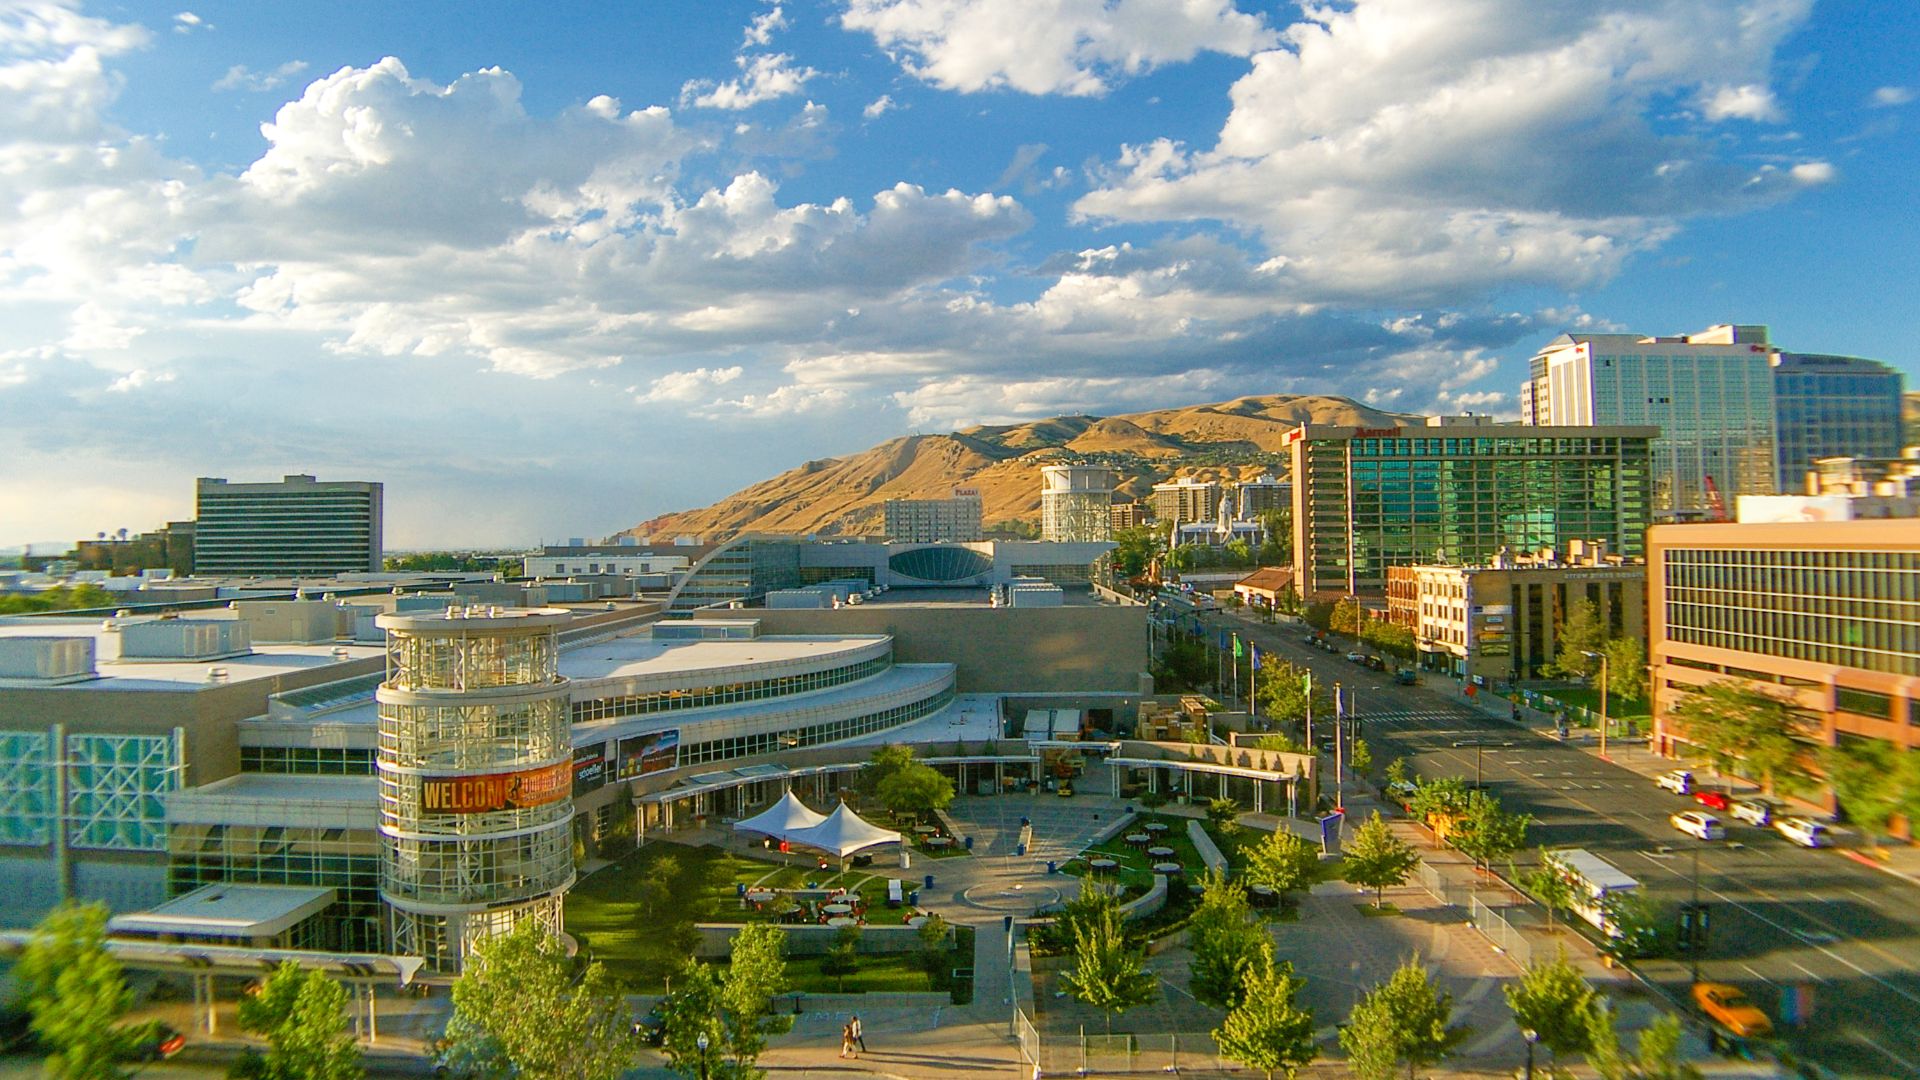
Salt Lake City, Utah
Median home prices at $571,928 clash sharply against a $72,951 income in Salt Lake City. The 7.8x divide ranks among the nation’s toughest. Rapid growth and tight land supply create a market that strains every potential buyer's budget.
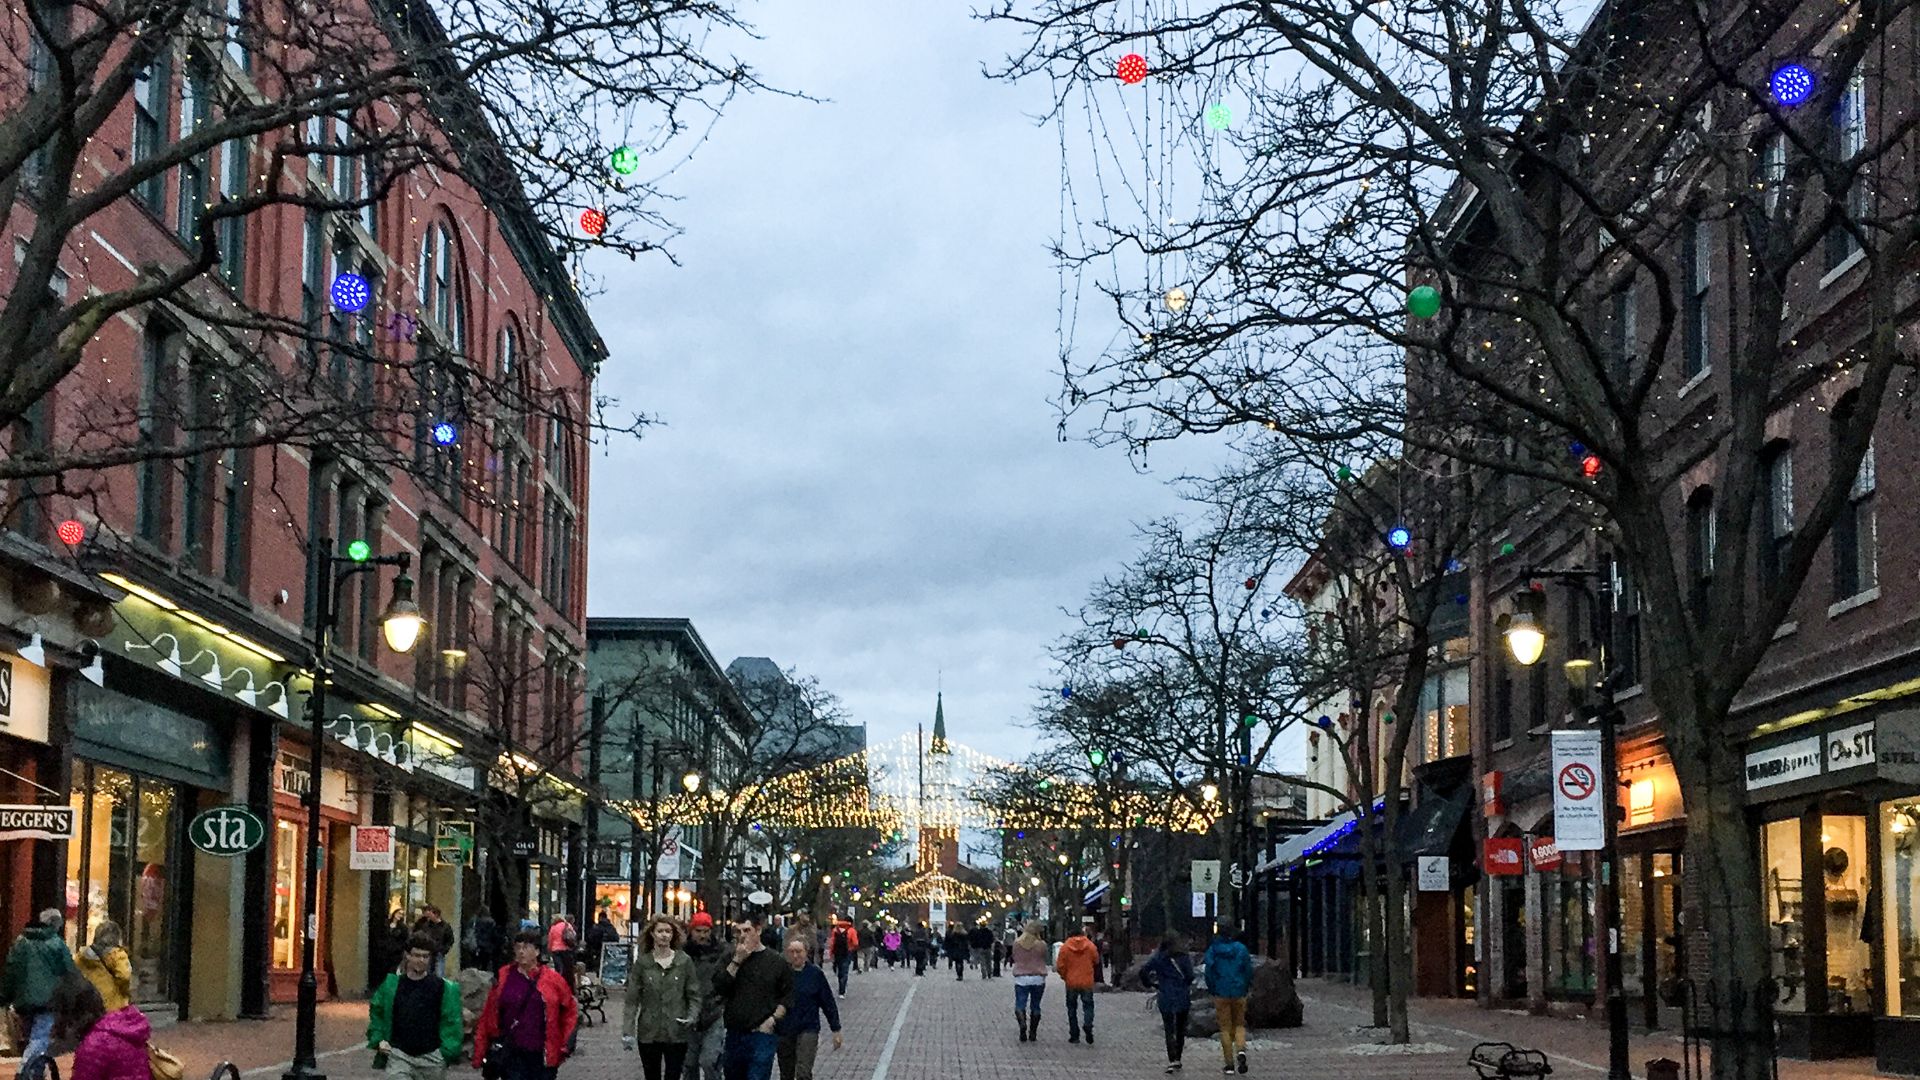
Burlington, Vermont
Overlooking Lake Champlain, Burlington blends scenic calm with growing price pressures. The average home runs roughly $505,850, compared to incomes around $68,854, and this makes a 7.4x ratio. With demand outpacing supply, Vermont’s largest city now feels far pricier than its tranquil image suggests.
 Kenneth C. Zirkel, Wikimedia Commons
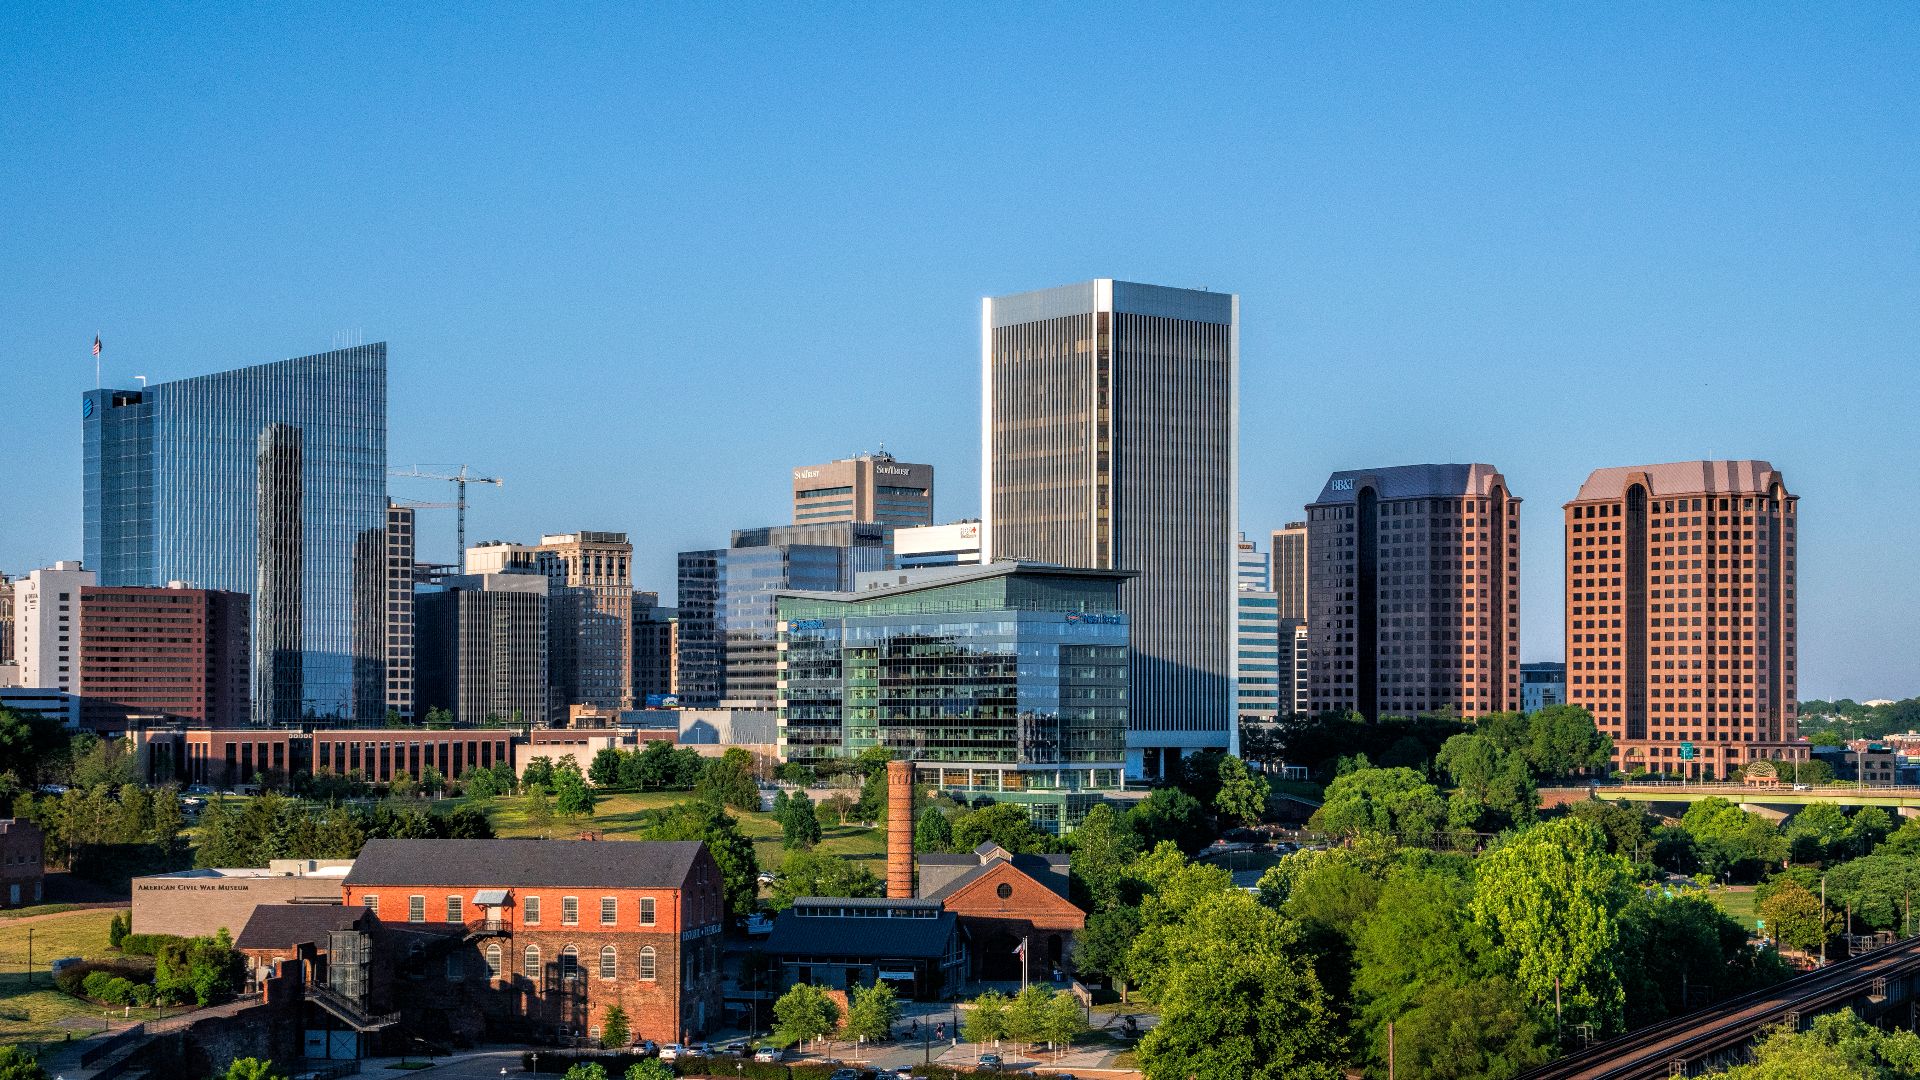
Richmond, VA
Richmond’s skyline grows taller as homes climb higher in price. At $371,213 for the average house and $65,350 in income, the 5.7x gap shows who gets left behind. Expansion is reshaping neighborhoods and leaving some longtime residents priced out of the city they know.
 Bruce Emmerling, Wikimedia Commons
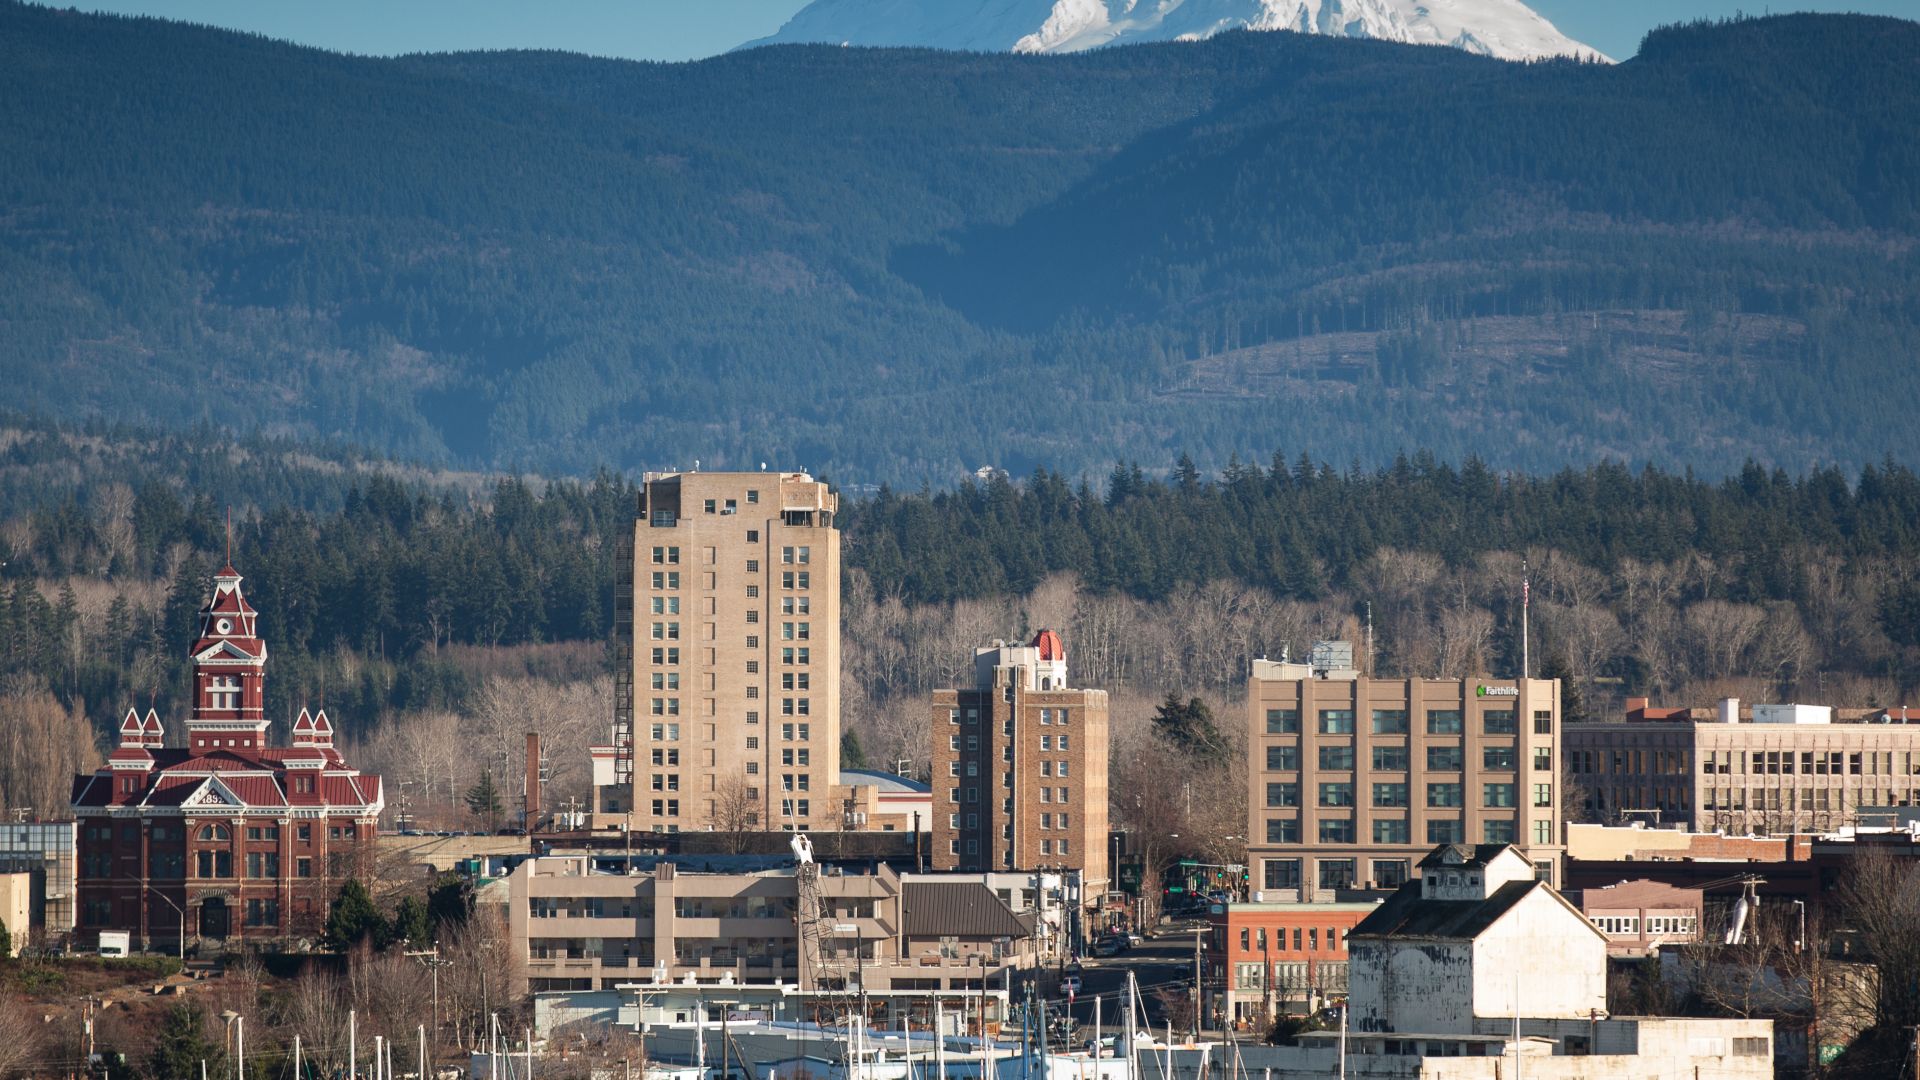
Bellingham, WA
Hidden between the San Juan Islands and the Canadian border, Bellingham’s beauty comes at a steep price. A typical home runs around $633,071, and incomes hover near $65,821—a striking 9.6x ratio.
 Nick Kelly / Faithlife Corporation, Wikimedia Commons
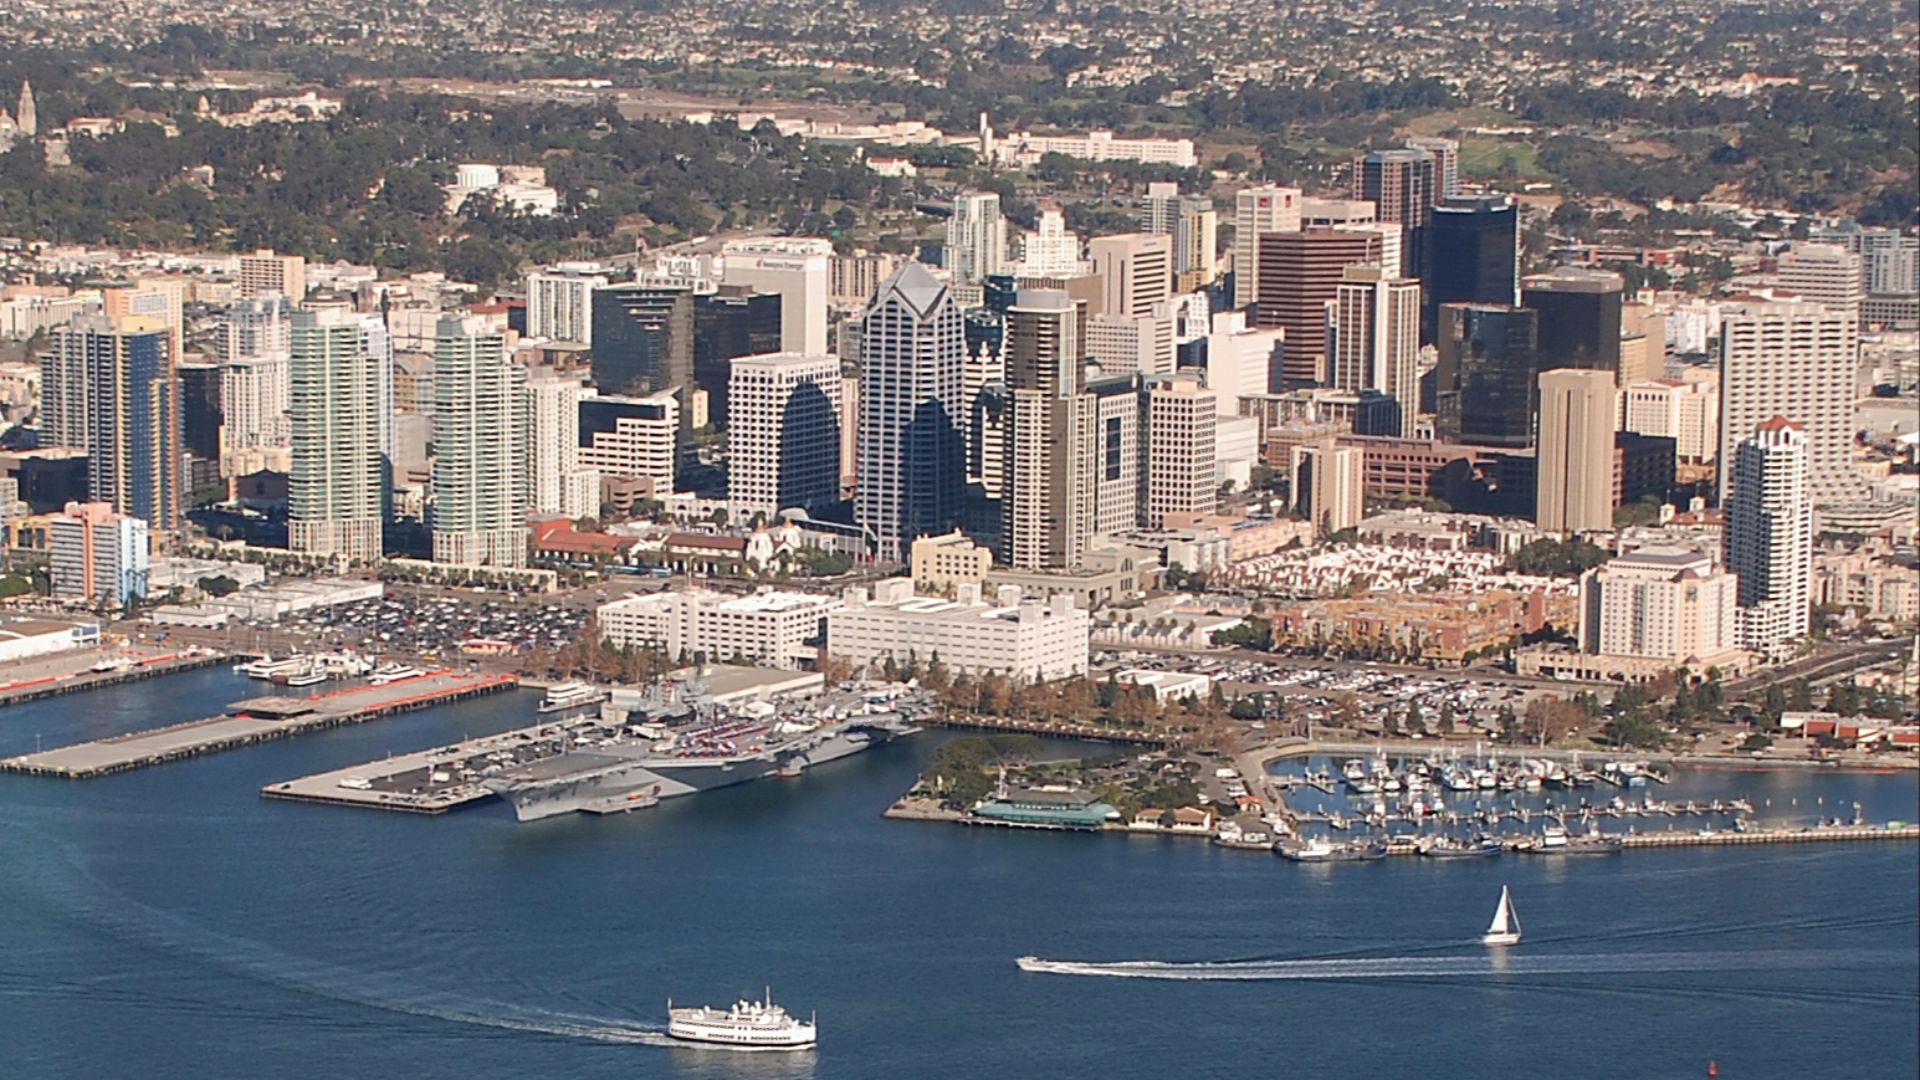
San Diego, CA
Many residents feel priced out of San Diego. Homes sell for $950,012 on average, far above the $96,964 median income. Scarce land and tight codes make this access almost impossible and leave locals to rent or watch dreams of ownership drift away.
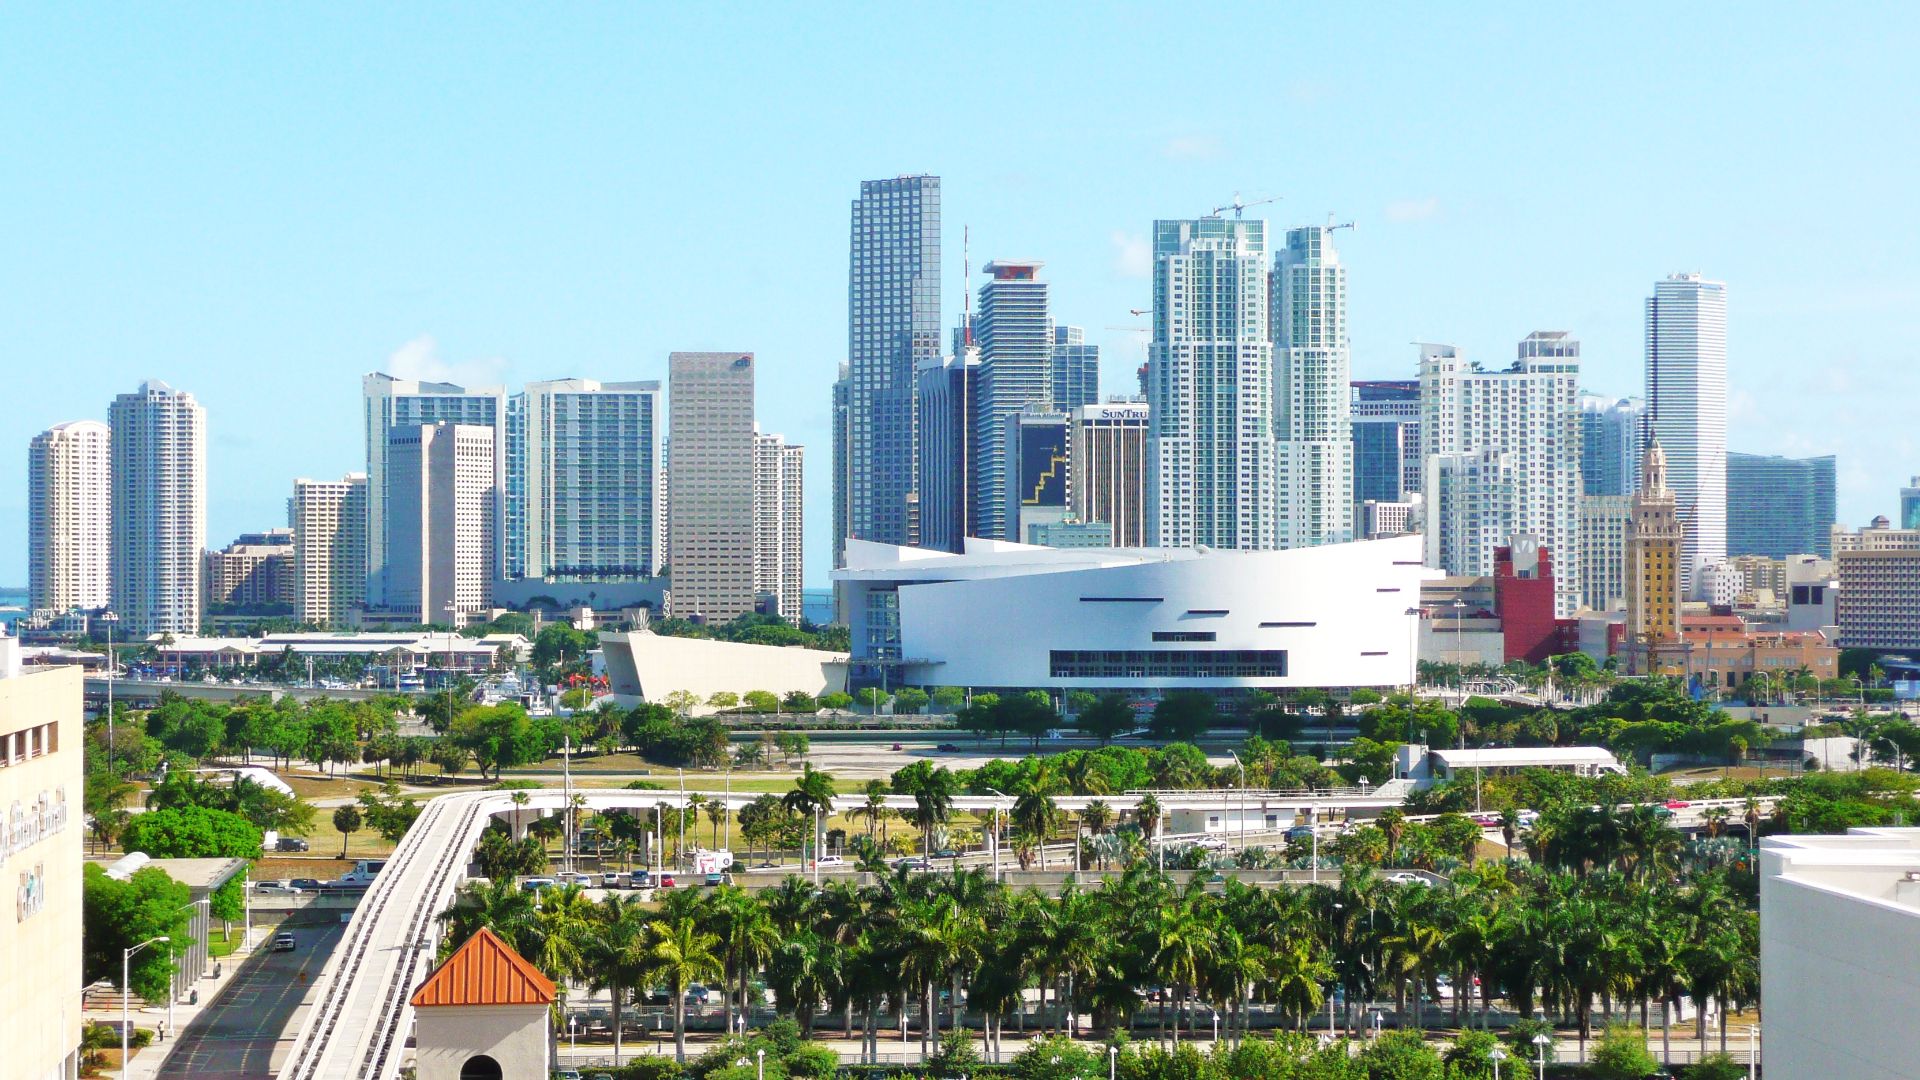
Miami, FL
Tropical charm masks Miami’s severe housing crunch. Global buyers, high insurance rates, and short-term rentals have turned paradise into one of America’s toughest markets. The median home price has climbed to $588,264, and incomes linger around $54,858—roughly a 10.7x divide.
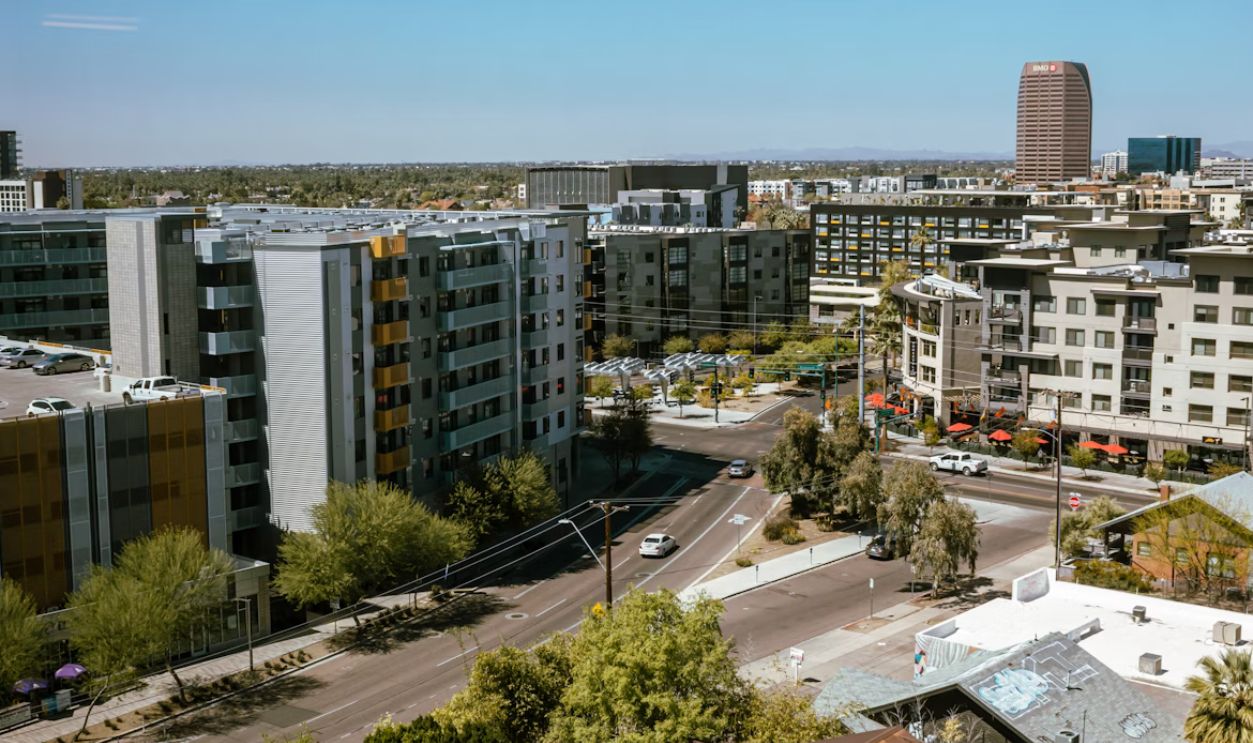
Phoenix, AZ
The desert sprawl continues to stretch thin. Phoenix homes average $415,258, while the city’s typical income sits at $72,092, forming a 5.8x gap. Rapid migration and limited water resources are testing sustainability as housing access fades beneath the desert sun.